|
In This Series:
Preamble
(download .pdf)
Our Intent
(download .pdf)
How Can We Do It?
(download .pdf)
What Do We Expect From Our Selection Criteria?
(download .pdf)
Will We Find Any Significant Trend?
(download .pdf)
What's Under The Hood?
(download .pdf)
Which Stations Are We Sampling?
(download .pdf)

Click the image above to order the Junkman's:
Junk Science Judo: Self-defense Against Health Scares and Scams.
Quick Links
Top Ten 'Most Embarrassing Moments' of 2004!
Junk science?
Junkman?
Short Course
Feedback
E-mail List
Archives & Links
Reading List
Fifth Anniversary
Contact JunkScience.com:
Steve Milloy
(Publisher) or
Barry Hearn
(Editor)
CSRwatch.com / SRIwatch.com

Support JunkScience.com
Shop Amazon.com
Consumer Distorts
DDT FAQ
Malaria Clock
Dioxin in Ben & Jerry's
Capitol Radiation
Our Swollen Future
Ozone 'Depletion'
GreenSpin
NumberWatch
Living Issues
Canada Free Press
|
Will we find any significant trend?
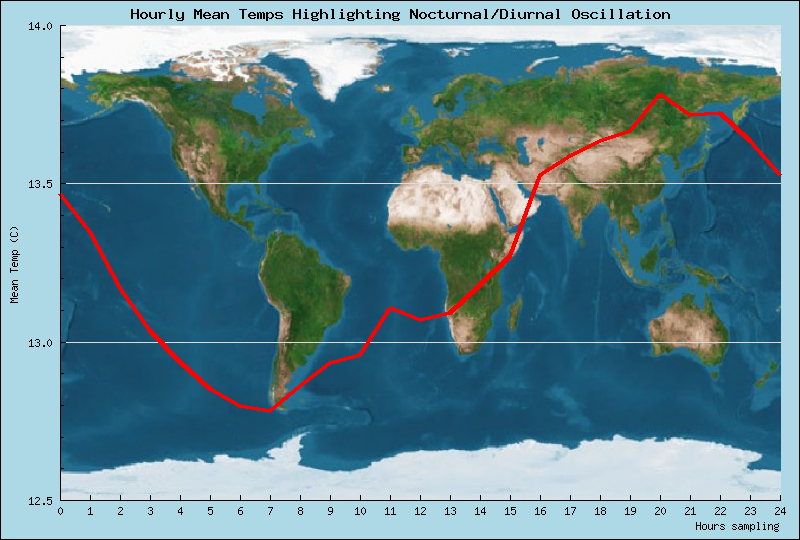
Ask us in thirty years or so. In the meantime, here’s a trial run cycle highlighting reported temperature variation:
 (click thumbnail to load full size graphic)
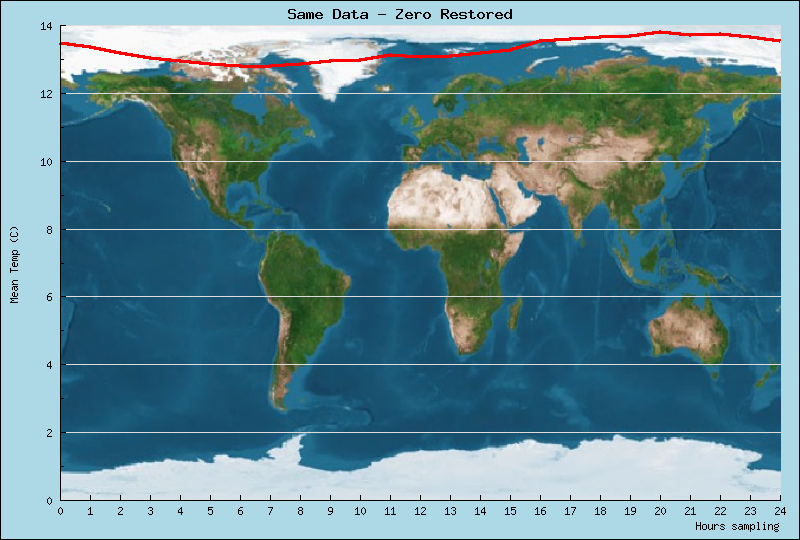
We have superimposed our temperature track over the world map so that the temperature track crosses the map at local noon. It looks very impressive to have such an apparent variation around the globe but that is an illusion of graphing style. The absolute range of sampled mean temperatures was 1 şC (12.78 şC – 13.78 şC) and the day’s mean was 13.27 şC (this was sampled Saturday, April 9, 2005 and we are working in GMT.) This is what it looks like with the Y axis restored to zero-base (filling in the “missing” portion):
 (click thumbnail to load full size graphic)
The estimated global mean (1951-1980) is usually cited as 14 şC ± 0.7 şC so our sampled day of 13.27 şC puts us in the ball park, at least. With our northern sampling bias and the northern hemisphere having entered spring, we anticipate our sampled day mean figure to creep (or leap) higher as we get into the hemisphere’s summer months.
Always providing our little application proves robust (i.e., survives the horrible things we do to try to break it during trials) we should commence public reporting of hourly estimated global mean temperatures May 2005.
<< Previous || Next >>
JunkScience.com
|