The "Ozone Layer" - what's going on?
Additional material August 2006. The Montreal Protocol and nasty countries (read: the U.S.) wishing to retain use of critical chemicals alleged to harm the "ozone layer"
continue to generate considerable press. What is it all about?
As every schoolboy should by now have read, total columnar ozone (the amount over a given point) would only amount to a paltry couple of millimetres if
brought down to sea level. So, does this mean that our defence, our critical solar shield we call the ozone layer, is a thin and fragile membrane about the
atmosphere, finite and being worn threadbare by assault from anthropogenic (human produced) chemicals? Hardly, although one could be forgiven for having such an
impression given the hysteria generated by various chemophobes and misanthropes. Stratospheric ozone is not a fixed and finite resource but is constantly
created - and destroyed - by solar radiation.
The table below contains thumbnail graphics of global monthly average ozone levels derived from Earth
Probe TOMS. Click on the thumbnail to load a copy of NASA's original 640 x 480 image in .gif format. The date range covers all available EP-TOMS data and
the months highlighted here are arbitrarily chosen as quarterly from September (greatest Antarctic Ozone Anomaly, incorrectly described as "the ozone
hole" by the press, actually a localised seasonal reduction).
So, what are we looking at?
September, and spring in the Southern Hemisphere, when returning sunlight powers significantly increased ozone destructive reactions in the super-cold
polar stratosphere and winter-strengthened circumpolar winds reduce atmospheric mixing from the currently ozone-overloaded temperate zone (lowest South Polar
and highest southern temperate zone levels are recorded in this season). Tropical levels are typically at their highest and Arctic levels about their most
moderate at this time of year.
December: South Polar vortex has largely collapsed and southern temperate and polar regions are ozone replete. Southern tropical levels are moderate
while northern tropical regions demonstrate some depletion as Arctic levels rise dramatically.
March: massive North Polar and Northern Temperate ozone levels are observed along with low-moderate levels in the Southern Hemisphere. Note that there
is no Arctic ozone anomaly. This is not because so-called ODS (Ozone Depleting Substances) are "map-heavy" and all fall to the South Pole. In fact,
anthropogenic emissions of these alleged nasties is significantly higher in the land- and population-dense Northern Hemisphere. The difference between the poles
is temperature - or rather, the lack of it. Ozone-destructive reactions are facilitated by Polar Stratospheric Clouds which are rare in the more-moderate North
and seasonal in the super-cold South.
June: North Polar levels are reducing, tropical and Southern Hemisphere levels are increasing once again - the cycle continues.
This change is largely cosmetic - i.e., while the monthly average total ozone graphics look
dissimilar before and after this change, actual ozone levels are not. So there we have it. The conceptual "ozone layer" is not some delicate, static and fragile wrapping about the outer atmosphere but rather a dynamic
and highly volatile component, both created and destroyed by solar radiation. Ozone creation is a continuous process, so we can not "run out" of
stratospheric ozone. The more ozone (O3) is destroyed, the more free oxygen radicals (O1) are available to bind with free oxygen (O2)
to create ozone (O3), the same applies with free oxygen (O2).
What about the all-important "solar shield" we hear so much about having to protect so that it will preserve us from UV bombardment? Well, not
much, actually. UVA (ultraviolet radiation in the 320-400 nanometer [nm] band), which is implicated in deep skin DNA changes thought responsible for melanomas,
is not blocked by ozone at all. [Note: De Fabo, et al, claim the reverse to be true for the cause of melanoma, at least in a mouse model - see: Ultraviolet B but not Ultraviolet A Radiation Initiates Melanoma. Meanwhile: Melanoma risk only partially associated with exposure to UVB from sunlight - The
report in the Dec. 21 [2005] issue of the Journal of the National Cancer Institute also indicates that only nonmalignant skin cancers (basal and squamous cell
carcinoma) are strongly associated with exposure to UVB radiation. (University of Texas M. D. Anderson Cancer Center)] UVB (270-320nm), which causes sunburn, is
both blocked by ozone (O3) and, if allowed to penetrate the atmosphere, creates ozone lower in the atmosphere where it can be an irritant in
photochemical smog - thick clouds also block UVB. UVC (<270nm), which would cause severe burns with short exposure, does not penetrate the atmosphere,
blocked completely by atmospheric oxygen (O2), in addition to ozone (O3). Regardless, life flourishes in the tropics, where stratospheric
ozone levels are never high and where solar radiation bombardment is roughly 1,000 times higher than that received in the region of the Antarctic Ozone Anomaly.
What's it all mean? Basically, sunburn is the last thing Ozone Al's Patagonian sheep and backyard rabbits would have to worry about if transported under the
so-called "ozone hole" in the South Pole's first light of spring. And, unless you intend sunbathing in the Antarctic in September, this seasonal event
will have no effect on you at all.
Addendum, August 24, 2006:
"Ozone hole stable, say scientists" - "Leading scientists in the
United States say the hole in the ozone layer of the Earth's atmosphere above the Antarctic appears to have stopped widening." (BBC)
How long has this seasonal cycle been going on? Same answer -- might have been doing so long before people figured out agriculture.
Look at the Climate Monitoring & Diagnostics Laboratory South Polar total ozone graphic
at right and note the interesting steps in apparent mean values.
Now look at the South Polar
temperature track below and note the step cooling at the same time as the sudden drop in apparent mean ozone.
Atmospheric ozone is measured in Dobson Units, named for the Oxford academic Gordon Miller Bourne Dobson (1889-1976), one of the pioneers of atmospheric ozone
research and inventor of the Dobson Spectrophotometer, used to measure atmospheric ozone from the ground. During the International Geophysical Year of 1956
there was a significant increase in the number of these devices in use around the globe and the Halley Bay (Antarctica) anomaly was discovered. Yes, that's 1956,
three decades prior to the allegedly alarming "discovery." There was a significantly different perspective then because interest was focused on the
November increase - now called a "recovery" - in stratospheric ozone levels over Antarctica with the collapse of the South Polar Vortex.
In a paper titled "Forty Years' Research on Atmospheric Ozone at Oxford: A History" (Applied Optics, March 1968), Dobson described an ozone
monitoring program that began at Halley Bay in 1956. When the data began to arrive, "the values in September and October 1956 were about 150 [Dobson] units lower than expected. ... In
November the ozone values suddenly jumped up to those expected. ... It was not until a year later, when the same type of annual variation was repeated,
that we realized that the early results were indeed correct and that Halley Bay showed a most interesting difference from other parts of the world." [em
added] Although South Polar temperatures do not appear to have been quite as low in 1957-58 as they have in recent years (a critical factor in ozone destruction)
Rigaud and Leroy [Annales Geophysicae (November, 1990)] reported atmospheric ozone levels as low as 110 DU observed at the French Antarctic
Observatory at Dumont d'Urville [opposite side of the South Pole from Halley Bay] in the spring of 1958. The South Polar Vortex, where
ozone destruction is greatest, was reportedly centred over Dumont d'Urville that year, which suggests any observed differences may be well within the bounds of
normal variability. Returning to "the hole", is the resultant surface UV irradiation high compared with the rest of the world? Nope, the tropics are much more heavily
irradiated every single day (it's part of the "tropical paradise" thing). In fact, the bulk of the temperate zones are more heavily irradiated than
the region "under the hole" every clear day of the year.
Is "the hole" of any real significance to people or the planet? Not so far as anyone can tell.
Should we worry about it? Unless you're a scientist earning a living from it, it's probably not worth a second thought.
Monthly average ozone graphics downloaded from toms.gsfc.nasa.gov April 2004.
See Erythemal UV Exposure here
Copyright © 2004, 2006 JunkScience.com. All rights reserved.
Major 'Oops!' September 2007: Chemists poke holes in ozone theory: Reaction data of crucial chloride compounds called into
question.
Earlier period predates data series.
September 1996

December 1996

March 1997
June 1997

September 1997
December 1997
March 1998
June 1998

September 1998
98/11 & 99/01 shown
December 1998 not available
March 1999
June 1999
September 1999
December 1999
March 2000
June 2000

September 2000
December 2000

March 2001
June 2001
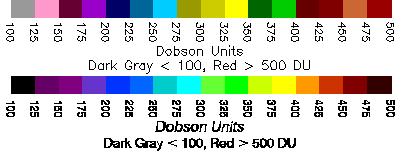
Change in image color scale occurs at this point.
Old and new colour scales compared.
September 2001

December 2001
March 2002
June 2002
September 2002
December 2002
March 2003
June 2003
September 2003
December 2003
 What's
"normal" for the region? No one knows.
What's
"normal" for the region? No one knows.
 Do
these represent some sort of phase shift in Antarctica? We don't know. Nor do we know if one event caused the other but a step shift in apparent mean
stratospheric ozone is a very peculiar result from a gradual accumulation of CFCs, no?
Do
these represent some sort of phase shift in Antarctica? We don't know. Nor do we know if one event caused the other but a step shift in apparent mean
stratospheric ozone is a very peculiar result from a gradual accumulation of CFCs, no?
 Is
stratospheric ozone "disappearing" around the world? No. The adjacent plot is from Mauna Loa Observatory and changes, if any, are trivial compared
with variability throughout the year.
Is
stratospheric ozone "disappearing" around the world? No. The adjacent plot is from Mauna Loa Observatory and changes, if any, are trivial compared
with variability throughout the year.