Changes to the 'Global Thermometer'
December 18, 2005
JunkScience.com
Updated: December 22, 2005
Updated: December 31, 2005
As of Noon (EST - 17:00hrs GMT), December 5, 2005, we have been unable to retrieve a significant number of METAR station reports. We had allowed for up to 5 missing reports in any hourly cycle and recorded Global Mean Temperatures provided a minimum of 998 station reports contained valid temperature data. We had not anticipated the sudden cessation of greater than 170 reports from our chosen 1,003 previously validated and, until December 5, reliable reporters.
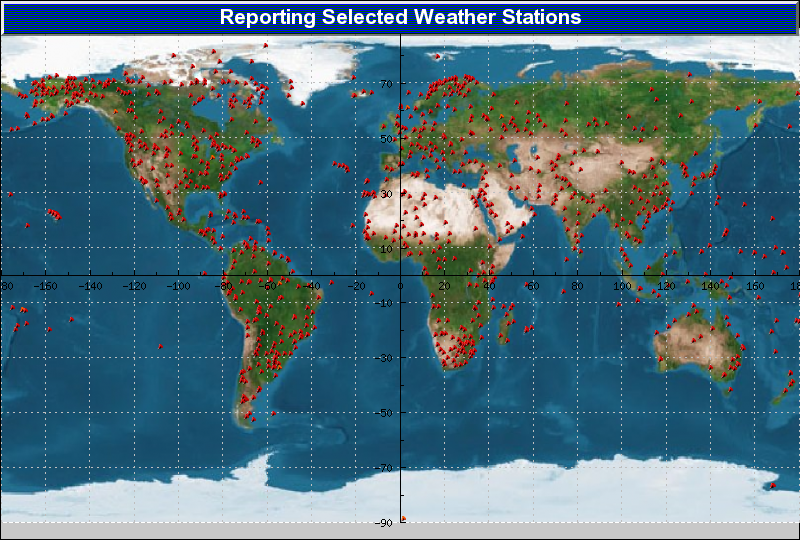
 Initially we suspected some colder region airports might have ceased functioning seasonally as the northern hemisphere heads inexorably into winter and this seemed at least intuitively reasonable. Looking at the graphic indicating locations of our selected stations certainly suggest winter could be a significant factor and, if you remember, we actively sought stations reporting from the frigid zones and biased selection to maintain all available in poorly represented regions and underrepresented latitude bands.
However, plots of still functioning and newly-failed reporters now make this an unlikely explanation.

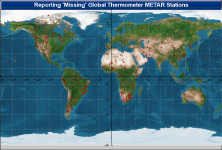 As can be seen by clicking on the adjacent thumbnail graphic at left, most of our far northern stations continue to report temperatures hourly, while the second graphic indicates much of the problem stems from North America (mainly Canada), South America, non-equatorial Africa, Southern and Central Asia and Indonesia.
Since NOAA owns and maintains the site where we access the various METAR files that constitute the data source for our 'Global Thermometer' we thought to ask them whether there were any changes in location or data format of which we should be aware. The response was not particularly illuminating, basically that NOAA host what people send them and that's an end to it. Just why roughly one-sixth of our source airports should stop reporting as from 17:00hrs GMT on December the 5th remains a mystery and we'd be pleased to hear from anyone who can provide illumination.
Update: please note that there could be a multitude of reasons for the apparently sudden loss of a block of reports, none of which involve a conspiracy - the stations might report via a transmission channel experiencing technical difficulties or perhaps the reports are funded by an organisation that has discontinued the reports for reasons of their own, etc., etc.. End update.
This now leaves us with something of a problem. Readers keep writing to find out what's happened, why aren't we displaying the temperature for their amusement and we keep saying it's not us but we're way outside our originally established parameters and temperatures derived now will likely be biased cooler than would be the case with the whole set reporting.
Update II: Many thanks to all who voted on a proposed course of action, in truth we didn't (alright, I didn't) expect 4,000+ people to send e-mail responses. Just shy of 0.1% of respondents feel we should scrap the project while, at time of posting, there is a difference of just 7 in the numbers who think we should simply carry on regardless and those who think we should start over. No problem, we think we know how to keep just about everyone happy - for the hyper-impatient, we have restored the numbers for now, just be aware that the number of responding stations is reduced - for those who agree that 1,000 stations is probably a bare minimum for trying to derive a land-based near-surface global mean temperature, just bear with us, a new version will come online with the new year. Here's the new regime and rationale:
- we are going to stick with the originally chosen base set of 1,003 reporting stations
- we are aware that the sudden cessation of reports from a block of stations threw a spanner in the works
- there is no guarantee this would not happen with another block of stations even if we select a new set
- the 'missing' stations may begin reporting again at any time
- we can maintain adequate reporting by substituting alternate values for missing station reports
- we risk inducing bias by substituting values from outside our selected station set
- the workaround for this is to substitute a derived value for each missing station report
- the latitude and longitude of each station is stored in a local database
- the overhead involved in creating a list of n stations in ascending distance from any desired station failing to report is not excessive
- deriving the average of the closest n reporting stations as an estimate for our missing value is relatively trivial
- trials have been conducted collecting reports from the 12 nearest reporters to arbitrarily selected reporting stations and the values calculated for each of the nearest 2 through all 12 reporting stations
- these empirical tests show we can derive the 'correct' value more than 50% of the time and ±1 °C more than 90% of the time by using the round of the average of the 4 nearest reporting stations when testing a set of 10 reporting stations for 5 consecutive hours and that this 'accuracy' did not improve using any number from 5-12 nearest reporting stations (frequently worse, increasing the error) - using fewer than 4 nearest reporting stations only gave us 'true' values 40% & 75% of the time, respectively
- empirical tests will need to be significantly more rigorous but we take this as proof of concept
So, there it is. Testing is not complete by any means but we think we can avoid inducing significant bias in the derived results and we think we should be able to keep results coming to suit those who like to see the numbers, even if they are less than optimal, and those who like to see the numbers as accurate as is practicable.
Bottom line: indicative numbers have been restored and better numbers are coming - just bear with us. End update II.
Meanwhile, since so many have been asking, here's the story so far:
Update III: Our beta trial version of the 'global thermometer' v0.1.05, going by the affectionate appellation of 'Hector', is retiring with 2005. With the arrival of 2006 comes our new and hopefully improved (certainly more robust) son of Hector, sporting the dashing handle of GTv1.0.1 (actually a re-branding of beta 0.3.02 - but don't tell anyone).
JunkScience.com