Barry Hearn
May 8, 2005
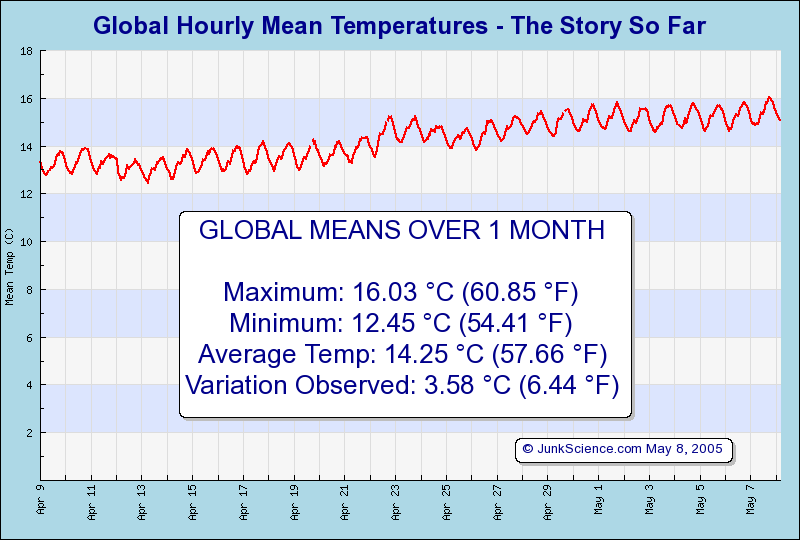
[First month's temperature track & 'analyses' below]
Taking the globe's temperature certainly seems to have captured the interest, or perhaps even the imagination of many of our readers. Although we had anticipated gathering more data before commencing commentaries - apart from our somewhat facetious Earth Day feature, at least - a steady stream of queries suggests we may be a trifle too reticent.
So, what have we discovered so far?
- People in general are not very patient:
- Some readers apparently want definitive answers - what is the Earth's temperature and is that abnormal?
- They want to know: what is the current trend and will it cause problems if it continues?
- They want the answer now - if not sooner.
- Some readers have little or no concept of how long it takes to establish climatic trends.
- People should know that changes over a matter of days constitute weather, not climatic change.
- Climatologists generally consider three decades a minimum requirement to detect a general trend.
- Advocates of AGW (Anthropogenic or human-caused Global Warming) assume any apparent warming to be both unnatural and proof of a) a problem and b) human malfeasance causing said problem.
- A little patience fellas - Fall follows Spring and Summer, when we anticipate mean temperatures (as we measure them) to decline.
- Advocates of AGW assume any apparent change to be both unnatural and proof of a) a problem and b) human malfeasance causing said problem.
- Take it easy - we are showing oscillation with increases when the major landmasses are sunlit and declines during their nocturnal phase - this was anticipated, read the accompanying documentation.
- Advocates of AGW assume our attempt to ascertain some facsimile of the global mean temperature to be proof of a) a problem and b) human malfeasance causing said problem.
- Looking at data is proof of a problem? We're still blinking at that one.
- Advocates of AGW assume our attempt to ascertain some facsimile of the global mean temperature to be proof of a) collusion with "Big Oil/Coal/Utilities/Industry"/"The Evil Empire"; b) our receipt of massive funding from same and c) human malfeasance causing said problem.
- So... Big/Evil whatever has subverted all airport meteorologists, causing them to misreport airport temperatures to the METAR database so we can "pretend" the Earth's temperature is cooler than actual... You fellas spend a lot of time worrying over black helicopters and such?
- Not that conspiracy theorists will believe it but this is strictly a JunkScience.com project, enjoys no sponsorship or funding of any description, runs on a pair of salvaged desktops utilising open source software and shares my domestic broadband internet connection.
FULL DISCLOSURE: I purchased commercial rights to utilise JpGraph (€ 85.00 ex tax) in order to present the "odometer"-style graphics displaying our derived temperatures relative to the supposed long-term mean of 14 °C.
- What "problem" this constitutes has us completely baffled.
We're guessing that the above is not what readers were looking for in the first Global Mean Temperature report but we certainly have found this an interesting experience.
Moving on to the first month's temperature track:
 Clicking on the thumbnail will open a full sized graphic (in a new window, if your browser setting permits it.)
Gaps in the track indicate hours where 1% or more of stations were not retrieved (usually in the small hours of the morning, my local time, as my service provider performed "upgrades") and the derived temperature was therefore omitted.
Points of interest so far include:
The predicted oscillation according to landmass and reporting location is quite apparent.
The prediction of derived temperature increment during the Northern Hemisphere Spring Season is holding - so far.
Some readers have expressed surprise (and some outright alarm) over the apparent volatility of our derived temperatures. Some of this is an artefact of reporting station location and some due to the nocturnal/diurnal effect on the concentration of landmass. Note also that this effect would be greatly accentuated were it not for genuine "greenhouse effect" because the hemisphere in planet shadow would cool so much more rapidly, winds would be horrific as the temperature differential between day and night hemispheres would be much greater and Earth would generally be a much less pleasant place going through a freeze/thaw cycle every 24 hours.
In summary, since temperatures are heavily influenced by solar radiation (down to the nocturnal/diurnal cycle, not to mention seasons), weather events (Polar breakouts, broad shading from large cloud formations...), geological events (explosive volcanic events), a plethora of interacting oscillations in various phases (ENSO, PDO, NAO, AO...) and even shading from bush fire smoke plumes we do not anticipate "stable" temperatures. We suspect some readers have been fooled by the breathless press reports of some month or year being n parts of a degree warmer/cooler than anticipated. Such reports bear little relation to the real or perceived world but are the product of highly processed data as we accumulate numbers, adjust them to ostensibly make highly corrupted urban measures reflect rural temperatures (often not collected anymore), fit arbitrary "norms" (get rid of the actual numbers by subtracting a figure representing averaged recordings, averaged over that month/season, averaged over some number of years) and thus end up with a statistical ± something. The planet's actual temperature, however, does not behave as the smoothed norms generated by statistics packages but is volatile and in constant flux, at any given moment either warmer or cooler than the moment preceding but highly unlikely to be exactly the same at two consecutive "snapshot" measures.
What's the global mean temperature? This looks about right:
JunkScience.com