Hurricanes: are they or aren't they?
JunkScience.com
August 20, 2006
It's peak North Atlantic hurricane season again and, perhaps inevitably given the noise generated by Al Gore and his multimedia presentation doing the rounds of theatres and town halls as the infomercial "Inconvenient Truth", much is being made of increased hurricane threat as a result of human-induced (anthropogenic) global warming (AGW). This is a contentious issue, to say the least, with a great deal of "he said, she said" making the situation as clear as mud. Let's see if we can't slice through a little of the heated rhetoric and try to find any cold facts that may be available.
On the "Yes it is" side of the ledger, we've had releases of studies such as: Anthes, 2006 Hurricanes and global warming—Potential linkages and consequences1, Emanuel, 2005, Increasing destructiveness of tropical cyclones over the past 30 years2, Webster, 2005, Changes in tropical cyclone number, duration, and intensity in a warming environment3, Trenberth, 2006, Atlantic hurricanes and natural variability in 20054. Meanwhile, there is also the "not too sure about that" through "is not" camp represented by: Trenberth, 2005, Uncertainty in Hurricanes and Global Warming5, Klotzbach, 2006,
Trends in global tropical cyclone activity over the past twenty years (1986-2005)6, Michaels, 2006. Sea-surface temperatures and tropical cyclones in the Atlantic basin7, Landsea, 2006, Can We Detect Trends in Extreme Tropical Cyclones?8. That we have authors apparently in both camps is not unusual, this is a complex field and there is a general paucity of data, so opinions will vary and evolve. The above is certainly not an exhaustive list, merely representative and no paper is suggested as being a particularly outstanding example. There are plenty of examples around that we feel display unwarranted confidence in their conclusions and some that seem ideologically driven.
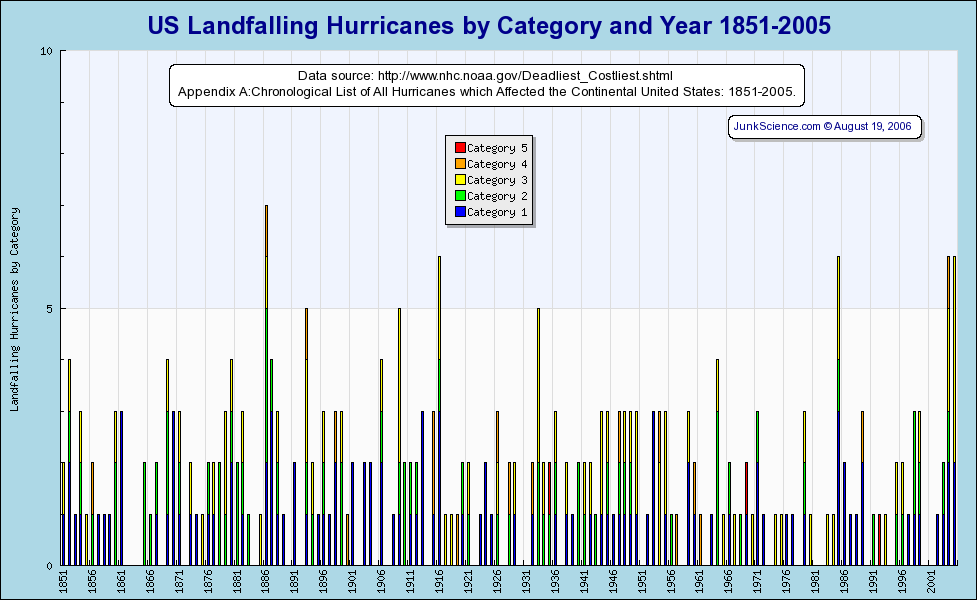
 We know a lot of people like to get right down to the fine art of torturing statistics until the numbers talk but we prefer to start by simply plotting the numbers in more or less their native form and then begin to develop our impressions from there. With that in mind we present the plot from the Chronological List of All Hurricanes Which Affected the Continental United States: 1851-20059 (as always, click the graphic to load the larger image).
What can we see from this first plot? Well, 2004 and 2005 represent the only time in this short record that there have been two consecutive years with more than four US Landfalling hurricanes. Not exactly proof of global warming-enhanced hurricane activity though.
How about the raw numbers then? 1928 is the center of our series and from then until time of writing there have been 134 US landfalling hurricanes, while from 1851-1927 there were 145. Not a lot in it certainly but definitely no increase.
Has there been an increase in the number of very stormy seasons, perhaps? Apparently not, with nine years exceeding three hurricanes in the first half of the record and only five such occurrences in the second half. About the only "win" we can see for the second half is having twelve category 4 & 5 storms compared with nine in the first half (that may have more to do with data collection but it is what is in the record).
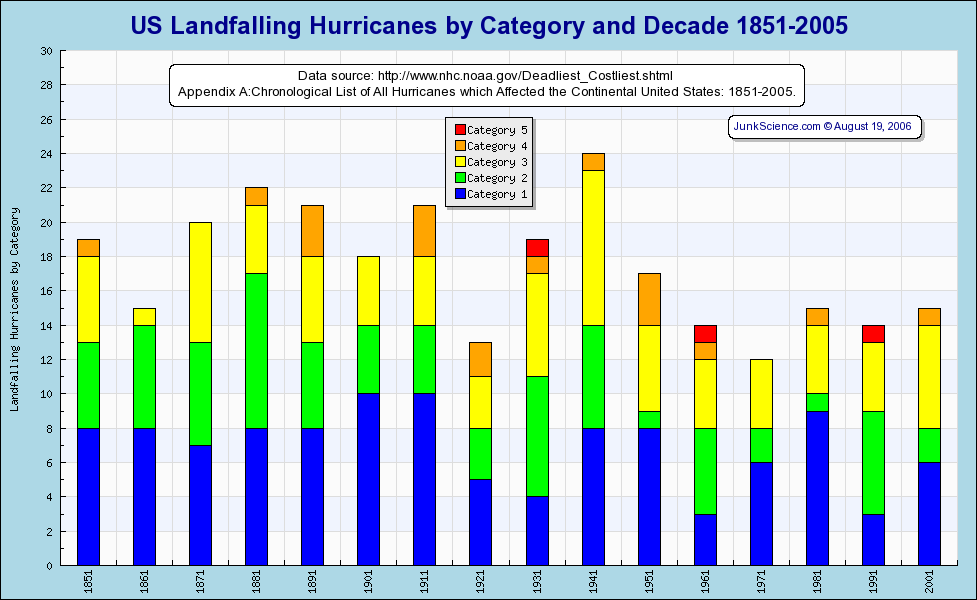
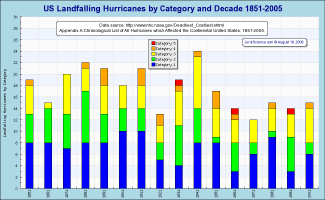 Looking at the series by decade it is apparent the 1920s were anomalously quiet, followed by surging numbers in the 30s and 40s, going quiet again right through the remainder of the Twentieth Century. The first half decade of the Twenty-First Century certainly looks ominous at first blush but we have no way of knowing how it will pan out with annual counts of 0, 1, 2, 6 & 6 -- it could be a biggie or it might just be ordinary.
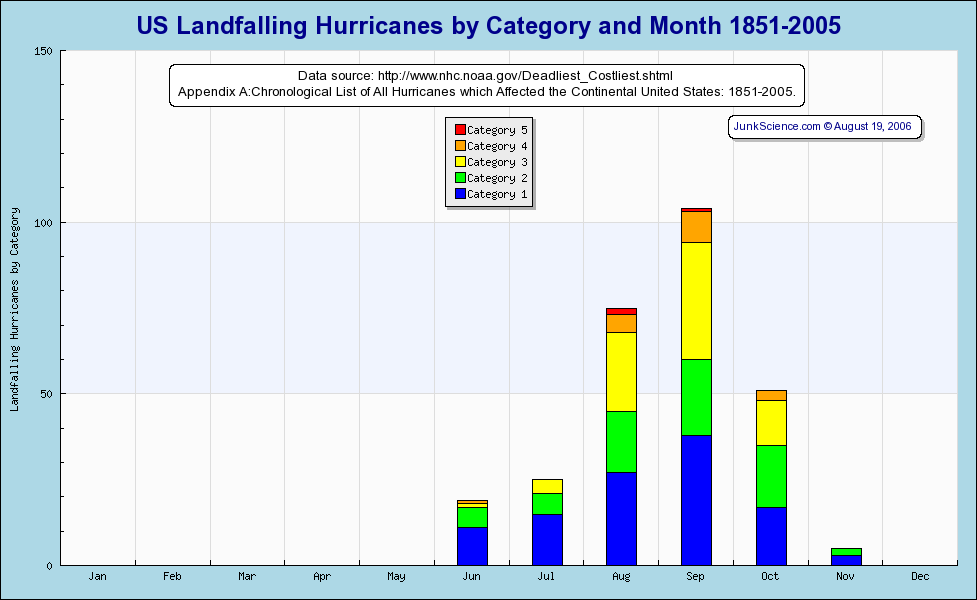
 We are currently on the threshold of peak hurricane season, roughly 27% of listed storms have occurred in August (including 2 of 3 category 5 hurricanes), 37% in September, including the only other "monster" to strike the continental US. It is not at all clear whether the relative quiet in the first third of peak season (with no hurricanes and just three named storms so far) can be taken as any sort of predictor of the season as a whole. This may yet be the third busy season in a row -- we will just have to wait and see.
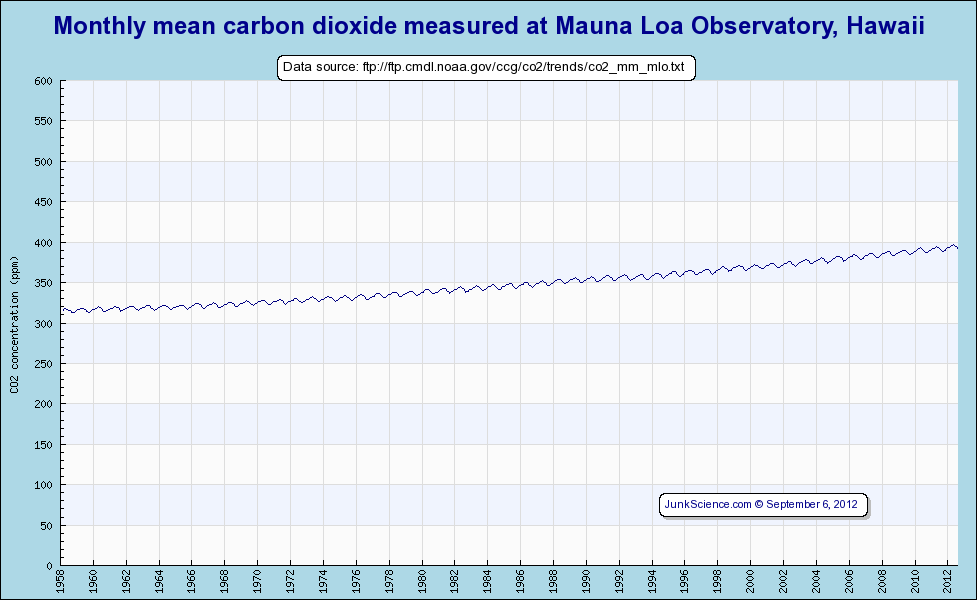
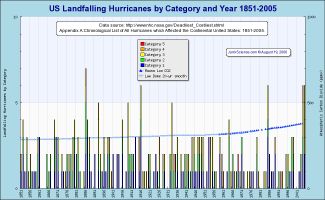 The question originally posed, of course, was whether increasing atmospheric carbon dioxide levels, and by extension enhanced greenhouse ("global warming"), is associated with more or more-severe hurricanes and so it is obligatory to plot storms against atmospheric carbon dioxide levels.
Curiously, the post World War II period of greatest fossil fuel use and associated increase in atmospheric carbon dioxide is concurrent with the most sustained quiescent period in the record. Surely this does not disprove any association between enhanced greenhouse and hurricane number or severity but, equally surely, it lends no support to the contention either.
We make no secret of being less than enthusiastic about the way some people make much of small concurrences and weak associations, a trait which leads to some fairly hostile email arriving in our mailboxes on occasion. To save the usual coterie of hostile correspondents the trouble of emailing perhaps we might offer a small example here of how latching onto small associations and apparent correlations can lead to less than useful conclusions.
 The level of atmospheric carbon dioxide10 rises and falls through the year in a predictable cycle. This is an artifact of continental configuration with the bulk of extra-tropical land being in the northern hemisphere and draw-down of the atmospheric carbon dioxide resource during the northern hemisphere growing season. The period August through October is the period of greatest draw-down or depletion of the resource. The period August through October is also peak hurricane season. The number of hurricanes in a given month is inversely proportional to the monthly trend in atmospheric carbon dioxide. Thus higher atmospheric carbon dioxide levels suppress Atlantic Basin hurricanes*. Quod erat demonstrandum.
*
Please note that this is a facetious demonstration of inappropriate conclusions from a weak association. It is definitely not a serious contention.
While we are on the topic of misleading representation and flawed conclusions we should remind readers to be very careful interpreting visual information. At the same time we need to be careful about temporal perspective too -- it is all too easy to focus on the recent record because we have useful quality, easily handled digital data and it's only a few clicks away.
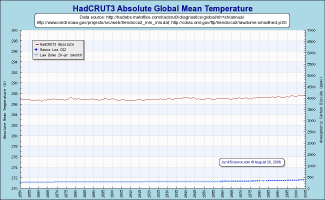 At right we have a somewhat different representation of Earth's mean temperature and atmospheric carbon dioxide trend, at least, it's likely very different from how you normally see it depicted. Can you see what is different? Have no illusions, you have likely seen exactly the same data plotted before.
The temperature plot is the HadCRUT3 anomaly series11, which is the variation from the estimated 1961-1990 mean of 14 °C (287.15 K) and to which we have added back the mean to derive the absolute temperature in K.
The atmospheric carbon dioxide plot is the same Mauna Loa series that we showed you before.
The only difference is that we plotted ranges that better suit planetary history than human short-termism. In terms of Earth's history, contemporary atmospheric carbon dioxide levels are low -- almost disastrously so. And the temperature plot? That's simply on a range to suit the planet's history, making current estimates appear pretty ordinary.
Do we suppose the planet has warmed over the last century or two? Almost certainly but equally certainly not very much from a planetary perspective and, when viewed on a more appropriate scale, nowhere near "dangerously." This is why we consider the IPCC estimate of 0.6 ± 0.2 °C warming over the Twentieth Century "trivial" -- a change in planetary mean temperature of 0.2% is neither here nor there. "Since 1870/1880" numbers are virtually identical to 20th Century change because, by happy accident as the temperature oscillated, estimates of global mean temperature for 1870, 1880 and 1900 are virtually identical. It would be equally correct to say "since the end of the Little Ice Age" but mention of unfortunately cool periods as commencement of record is not seen as politically correct.
Returning to US Landfalling Hurricanes, it looks strongly as though the years 2004 and 2005 were simply an unlucky anomaly since hurricane trends bear no similarity to the annual atmospheric carbon dioxide trend and by extension enhanced greenhouse ("global warming"). The last time there were fifteen landfalling hurricanes in four years was back in the '80s -- the 1880s. Even so, the 1880s ended up having only one or two more landfalling hurricanes than the preceding and subsequent decades and thus history cautions us against making rash claims regarding whether the opening decade of the Third Millennium will likely become a record-breaker. We'll wait and see -- but history suggests it's somewhat unlikely.
Suggested additional reading:
References:
- Anthes, R.A., et al., 2006. Hurricanes and global warming—Potential linkages and consequences. Bulletin of the American Meteorological Society, 87, 623-628.
- Emanuel, K., 2005a. Increasing destructiveness of tropical cyclones over the past 30 years. Nature, 436, 686-688.
- Webster, P. J., et al., 2005. Changes in tropical cyclone number, duration, and intensity in a warming environment. Science, 309, 1844-1846.
- Trenberth, K. E., and D. J. Shea (2006), Atlantic hurricanes and natural variability in 2005, Geophys. Res. Lett., 33, L12704, doi:10.1029/2006GL026894.
- Trenberth, K., 2005. Science, 308, 1753-1754
- Klotzbach, P.J., 2006. Trends in global tropical cyclone activity over the past twenty years (1986-2005). Geophysical Research Letters, 33, L010805, doi:10.1029/2006GL025881
- Michaels, P.J. et al, 2006. Sea-surface temperatures and tropical cyclones in the Atlantic basin. Geophysical Research Letters, 33, doi:10.1029/2006GL025757
- Landsea, C., et al., Can We Detect Trends in Extreme Tropical Cyclones? Science, 313, 452-454
- The Deadliest, Costliest, and Most Intense United States Tropical Cyclones From 1851 to 2005, NOAA Technical Memorandum NWS TPC-4, Appendix A: Chronological List of All Hurricanes which Affected the Continental United States: 1851-2005.
- Monthly mean carbon dioxide, Mauna Loa Observatory, Hawaii.
- HadCRUT3 Diagnostics: global average (NH+SH)/2
Copyright © 2006 JunkScience.com - All Rights Reserved