"Global Warming" Proxies
JunkScience.com Due to the expanding nature of this resource it has become necessary to split the file, something that may again be necessary in the near future. If you
are looking for contemporary temperature data, click here. Note: this section under construction - more to come.
Moberg, A., et al. 2005 ABSTRACT: 2650-Year Beijing Stalagmite Layer Thickness and Temperature
Reconstruction Konrad Hughen et al believe they have found anthropogenic warming signal at Soper Lake (Hudson Strait coast, Baffin Island) and perhaps they have. The
following, longer record from Donard Lake (Davis Strait coast, Baffin Island) produced by Moore et al is somewhat at odds with the Soper reconstruction.
Of the Arctic coastal proxies we have examined to date, the shorter and longer Baffin Island series, Coastal Northern Norway, Yamal Peninsula and our
landlocked Central Greenland record, only the short Baffin Island series indicates anomalous Twentieth Century warming. In fact, Soper Lake delivers the only
story of contemporary warming in the series of over a dozen temperature reconstructions we have extracted and presented to date. Why we do not know.
It is entirely possible that all future series we extract will lend support to this lonely series' suggestion of warming but, at this time, we must suggest
that Soper Lake is anomalous and warming, if not an artefact of the study (something that must always be considered), is purely a local phenomenon (perhaps like
the anomalous Antarctic Peninsula?).
Climate in Medieval Time. A local .pdf copy of the original is available here should the above link change or fail.
Jones, P.D. and M.E. Mann. 2004. Note: we have extracted individual records (instrumental and proxies) from the rather frantic presentations of Jones and Mann (if nothing else, they
make a convenient one-stop location for multiple proxy series). Such items as the Central England Temperature Record and HadCRUTv2 Northern Hemisphere tracks
are available in the regularly updated contemporary series on the graphic intensive and reduced bandwidth pages and are not reproduced here.
Fennoscandia looks pretty much as everyone would expect from viewing the various Arctic records available with apparent warming to the 1930s with subsequent
fall and recovery, although with no net gain over the period of maximum atmospheric carbon dioxide growth.
Why there has been no apparent temperature increment over that period remains a mystery since the enhanced greenhouse hypothesis is really quite insistent
that dry, cold air masses should exhibit significant response to additional atmospheric carbon dioxide and yet the Arctic and Antarctic display considerable
reluctance to demonstrate the effect.
Clearly in the Mann reconstruction trees in the Western, or Pacific US responded to the Medieval Warm Period and Little Ice Age with much of the record
indicating temperatures higher than the reference mean of 1751-1950.
Western US tree density gives the impression of noise with little indication of a trend over almost four centuries.
Finally (in this graphic expansion), Luckman's Jasper reconstruction suggests most of the millennium was warmer than the reference period, with the modern
thermometer record based in the coldest portion of recent temperature history and tracking the recovery.
We move on now to the North Atlantic (fig 4b)
composed of West Greenland (Ice Cores, Fisher, years 553-1982); Chesapeake (Shells, Cronin, years 5-1995) and; Greenland/Winter (Ice Cores, Vinther, years
1245-1970). If you ignore the paucity of data in the Chesapeake series you might see the suggestion of a hockey stick shape (squint a bit, perhaps) but ...
Obviously Tornetrask supports only a stick with a broken shaft.
Similarly, the trees of the Polar Urals are being a little unkind in the search for hockey sticks, too.
This leaves us with the Czech decadal series looking promising, although the effect is rather spoiled by the warming spike at the end of the 18th
Century which makes 20th Century warming look merely mildly anomalous.
Not much to say here, the major anomaly being somewhat unusual chill in the 19th Century.
Now there's something of a quandary because we've plotted much of the northern hemisphere source reconstructions archived by Jones and Mann at the World Data Center for Paleoclimatology and yet we have discovered little reminiscent of their
'spaghetti-grams' to date. Perhaps the tropical series would prove illuminating...
We still need to extract the numbers used for figure 4f - the numbers for Cook (Tasmania) are readily available but we need to track down the Law Dome series
used (the alleged repository no longer exists - bear with us). Meanwhile, there's lots more reconstructions below - enjoy.
Update: Dr. Tas van Ommen has promptly supplied the data (as supplied to Jones and Mann) but requested these not be distributed as they are soon to
release a much longer, updated version. We await with interest.
Download the reconstructed China temperature data from
the WDC Paleo Archive.
Historical Isotopic Temperature Record from the Vostok Ice Core Contains an excellent representation of the Holocene Maximum and Medieval Warm Period in southern equatorial Africa.
Gajewski, K., 1993, Climate Reconstructions from Pollen. IGBP PAGES/ We now present all 8 lakes in the series on separate plots. Individually and collectively they make an interesting view of the descent into and the
(partial?) recovery from the Little Ice Age (LIA). Any correlation between temperature and precipitation is opaque.
Northern Hemisphere Temperature Reconstructions (Science v289 p.270, 14 July 2000 Given the variation exhibited by varied near-surface measures and proxies perhaps it is time to set these aside for a moment and see what can be determined
about the atmosphere. This, after all, is where anthropogenic global warming should manifest itself and should be where it is to be found (always
provided the hypothesis is sound). With this in mind we might pause in our self-appointed task of presenting proxy data for all to see and divert to
balloon-borne radiosonde measurements of the atmosphere. Plotting the 850-300mb or 850-100mb atmospheric pressure bands may be instructive on what is happening outside
the urban heat bubbles. Hopefully this will tell us more. Radiosonde balloon data plot now available here.
In the meantime, what we have discovered is that examination of proxy records from grape harvest dates to ice cores in the absence of attempts to append
urban instrument readings show nothing alarming and that adherence simply to longer-term near-surface instrument measures (e.g. the Central England
Temperature amalgam) similarly shows no problem (some significant 17th Century warming but no problem). The alarm always seems to occur when we try
to blend proxy with measure and our task now is to determine whether there is any validity to that alarm. Stay tuned.
Pre-instrumental climate: how has climate varied during the past 500 years? (.pdf)
Bradley, R.S., 1991 In: Greenhouse Gas-induced Climatic Change (ed. M. Schlesinger) Elsevier, p.391-410.
4. CLIMATE OF THE LAST 500 YEARS: THE HISTORICAL EVIDENCE A local .pdf copy of the original is available here should the above link change or fail.
Spannagel Cave Stalagmite Oxygen Isotope Data and Temperature
Reconstruction
ABSTRACT: Spring/summer (March-September) temperatures
reconstructed for the Gulf of Alaska, 1762-1988.
Gulf of Alaska warm season (April-September)
dendroclimatic reconstruction, 1734-1983.
Tasmania Temperature Reconstruction
Temperature in central Greenland
DESCRIPTION: An international team of scientists
has reconstructed the Sun's activity over the last 11 millennia and forecasts decreased activity within a few decades Figure at right - Top: Reconstructed sunspot activity (10 year average) for the last 11,400 years based on C-14 data (blue curve)
and the directly observed historical sunspot data since 1610 (red curve). The reliable C-14 data ends around the year 1900 so that the sharp increase in sunspot
activity in the 20th century does not appear in the graph. The reconstruction shows clearly that a comparable period of high sunspot activity previously existed
over 8000 years ago. Below: An enlarged section of the upper graph (hatched area) with several episodes of higher sun activity; comparable to the 20th century. Image:
Max Planck Institute for Solar System Research
A local .pdf copy of the original is available here should the above link change or fail. As always, users should go to the
original source if at all possible.
Max Planck do not endorse the position that the sun is the major driver of apparent recent warming and, a few months prior to the above release, published
the following:
How Strongly Does the Sun Influence
the Global Climate? A local .pdf copy of the original is available here should the above link change or fail.
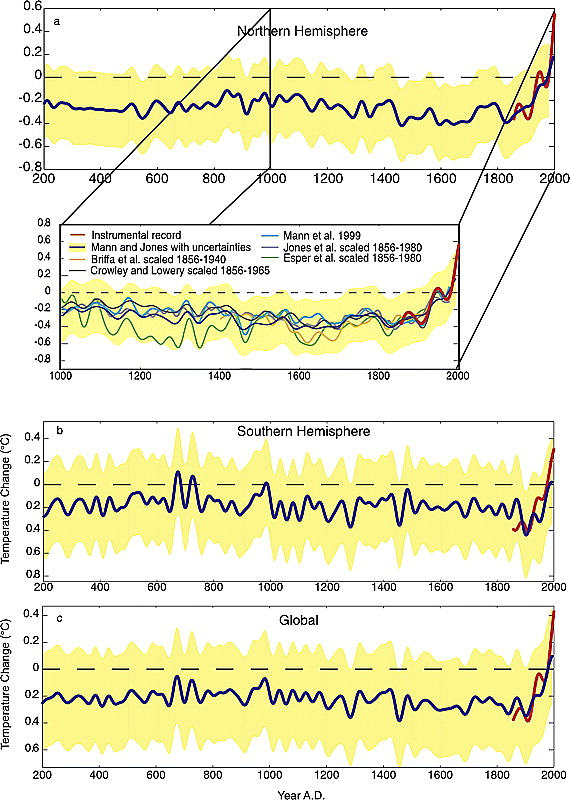
Since the plot is somewhat crowded we have split the last 2,000-odd years into separate plots for ease of viewing. It should be obvious to the casual viewer
that there is no sudden, unusual warming trend evident since the Industrial Revolution in any of the plots. Given Yamal's location in the Siberian Arctic
territory (for those have difficulty locating it on a map, think roughly 70N, 70E), Yamal should theoretically be highly responsive to enhanced atmospheric
greenhouse gas levels and enhanced greenhouse warming should stick out like, well, a tree on the tundra. That no such warming is evident here on Siberia's
Arctic coast is, to say the least, highly suspicious. Are the trees lying to us or is the atmosphere's sensitivity to small perturbations in minor trace gases
overestimated? The 1990s were allegedly the 'hottest decade of the hottest century of the millennium' - why didn't someone tell these Siberian larch trees?
Global-scale temperature patterns and climate forcing over the past six centuries A local .pdf copy of the original is available here should the above link change or fail.
Mann, M.E., R.S. Bradley, and M.K. Hughes. Geophysical Research Letters, 26, 759-762.
A local .pdf copy of the original is available here should the above link change or fail.
Global temperature patterns in past centuries: an interactive presentation.
Mann, M.E., E. Gille, R.S. Bradley, M.K. Hughes, J.T. Overpeck, R.S. Webb, and F.T. Keimig, 2000. Earth Interactions, 4-4, 1-29.
A local .pdf copy of the original is available here should the above link change or fail.
On past temperatures and anomalous late 20th century warmth.
Mann, M.E., Ammann, C.M., Bradley, R.S., Briffa, K.R., Crowley, T.J., Hughes, M.K., Jones, P.D., Oppenheimer, M., Osborn, T.J., Overpeck, J.T., Rutherford,
S., Trenberth, K.E., Wigley, T.M.L., 2003. EOS, 84, July 8, 2003.
A local .pdf copy of the original is available here should the above link change or fail.
Radically different in operation is the "Climate Audit" blog where you can read and discuss
the trials and tribulations of those hood-lifting, tire-kicking souls. Reviewing their site reveals the odd terse comment creeping in as frustration mounts with
refusal to provide data and ad hominem tactics (not to mention hockey fans attempting to break up discussions) but the site does allow dissent and does attempt
to explain the basics for those struggling with the statistics. Background links are provided in the right-hand column on that site.
HOME
Copyright © 2004-2005 JunkScience.com - All Rights
Reserved.
This article, including graphics, may be reprinted in full or in part with attribution.
October 15, 2005
Climate proxies:
2,000-Year Northern Hemisphere Temperature Reconstruction
2,000-Year Northern Hemisphere Temperature Reconstruction
IGBP PAGES/World Data Center for Paleoclimatology
 Data
Contribution Series # 2005-019.
Data
Contribution Series # 2005-019.
NOAA/NGDC Paleoclimatology Program, Boulder CO, USA.
A number of reconstructions of millennial-scale climate variability have been carried out in order to understand patterns of natural climate variability, on
decade to century timescales, and the role of anthropogenic forcing. These reconstructions have mainly used tree-ring data and other data sets of annual to
decadal resolution. Lake and ocean sediments have a lower time resolution, but provide climate information at multicentennial timescales that may not be
captured by tree-ring data. Here we reconstruct Northern Hemisphere temperatures for the past 2,000 years by combining low-resolution proxies with tree-ring
data, using a wavelet transform technique to achieve timescale-dependent processing of the data. Our reconstruction shows larger multicentennial variability
than most previous multi-proxy reconstructions, but agrees well with temperatures reconstructed from borehole measurements and with temperatures obtained with a
general circulation model. According to our reconstruction, high temperatures - similar to those observed in the twentieth century before 1990 - occurred around
AD 1000 to 1100, and minimum temperatures that are about 0.7K below the average of 1961-90 occurred around AD 1600. This large natural variability in the past
suggests an important role of natural multicentennial variability that is likely to continue.
GEOGRAPHIC REGION: Northern Hemisphere
PERIOD OF RECORD: 1 - 1979 AD
2650-Year Beijing Stalagmite Layer Thickness and Temperature Reconstruction
 Tan, M., et al., 2003,
2650-Year Beijing Stalagmite Layer Thickness and Temperature Reconstruction,
IGBP PAGES/World Data Center for Paleoclimatology
Data Contribution Series # 2003-050.
NOAA/NGDC Paleoclimatology Program, Boulder CO, USA.
ABSTRACT:
A 2650-year (BC665-AD1985) warm season (MJJA: May, June, July, August) temperature reconstruction is derived from a correlation between thickness variations in
annual layers of a stalagmite from Shihua Cave, Beijing, China and instrumental meteorological records. Observations of soil CO2 and drip water suggest that the
temperature signal is amplified by the soil-organism-CO2 system and recorded by the annual layer series. Our reconstruction reveals that centennial-scale rapid
warming occurred repeatedly following multicentennial cooling trends during the last millennia. These results correlate with different records from the Northern
Hemisphere, indicating that the periodic alternation between cool and warm periods on a sub-millennial scale had a subhemispherical influence.
Baffin Island 500 Year Summer Temperature Reconstruction
 Hughen, K., et al.,
2003,
Hughen, K., et al.,
2003,
Baffin Island 500 Year Summer Temperature
Reconstruction,
IGBP PAGES/World Data Center for Paleoclimatology
Data Contribution Series # 2003-074.
NOAA/NGDC Paleoclimatology Program, Boulder CO, USA.
GEOGRAPHIC REGION: Baffin Island, Canadian Arctic
PERIOD OF RECORD: 1514 - 1992 AD
ABSTRACT:
Laminated sediments from Upper Soper Lake on southern Baffin Island provide a new 500-year record of temperature change in the Arctic. Radiometric dating, using
210 Pb and Pu, shows that the light- and dark-coloured laminae couplets are annually deposited varves. Dark laminae thickness is strongly correlated to average
June temperature from Kimmirut (r = 0.82), reflecting the influence of temperature on snowmelt and fluxes of runoff and suspended sediment. This relationship
allowed the construction of a palaeotemperature record that documents large-amplitude interannual to decadal variability superimposed on distinct century-scale
trends, including 2°C average warming and maximum temperatures during the 1900s. Similar patterns of change are seen in individual and regionally averaged
palaeotemperature records from around the circum-Arctic. Upper Soper Lake records temperatures, rates of change and variance during the twentieth century that
are all anomalously high within the context of the last 500 years, and outside the observed range of natural variability. Comparisons of Upper Soper Lake and
Arctic average palaeotemperature to proxy-records of hypothesized forcing mechanisms suggest that the recent warming trend is mostly due to anthropogenic
emissions of atmospheric greenhouse gases. The magnitude of the warming and decade-scale variability throughout the records, however, indicate that natural
forcing mechanisms such as changing solar irradiance and volcanic activity, as well as positive feedbacks within the Arctic environment, also play an important
role.
Baffin Island 1250 Year Summer Temperature Reconstruction
 Moore, J.J., et al.,
2003,
Moore, J.J., et al.,
2003,
Baffin Island 1250 Year Summer Temperature
Reconstruction,
IGBP PAGES/World Data Center for Paleoclimatology
Data Contribution Series # 2003-075.
NOAA/NGDC Paleoclimatology Program, Boulder CO, USA.
ABSTRACT:
Clastic varved sediments from Donard Lake, in the Cape Dyer region of Baffin Island, provide a 1250 yr record of decadal-to-centennial scale climate
variability. Donard Lake experiences strong seasonal fluctuations in runoff and sediment fluxes due to the summer melting of the Caribou Glacier, which
presently dominates its catchment. The seasonal variation in sediment supply results in the annual deposition of laminae couplets. A radiocarbon date measured
on moss fragments, with a calibrated age of 860 ± 80 yrs before present (BP), is in close agreement with the age based on paired-layer counts. Together with
the fabric of the laminae determined from microscope analysis, the age agreement demonstrates that the laminae couplets are annually deposited varves.
Comparisons of varve thickness and average summer temperature from nearby Cape Dyer show a significant positive correlation (r= 0.57 for annual records, r =
0.82 for 3-yr averages), indicating that varve thickness reflects changes in average summer temperature. Varve thickness was used to reconstruct average summer
temperatures for the past 1250 yrs, and shows abrupt shifts and large amplitude decadal-to-centennial scale variability throughout the record. The most
prominent feature of the record is a period of elevated summer temperatures from 1200-1375 AD, followed by cooler conditions from 1375-1820 AD, coincident with
the Little Ice Age.
 It
seems odd, to say the least, that the more southerly Soper Lake should exhibit startling anthropogenic warming (if that is what is indicated, as assumed) when
Donard, almost on the Arctic Circle, does not.
It
seems odd, to say the least, that the more southerly Soper Lake should exhibit startling anthropogenic warming (if that is what is indicated, as assumed) when
Donard, almost on the Arctic Circle, does not.
Burgundy Grape Harvest Dates and Spring-Summer Temperature Reconstruction:
 Chuine,
I., et al.. 2005.
Chuine,
I., et al.. 2005.
Burgundy Grape Harvest Dates and Spring-Summer Temperature Reconstruction
IGBP PAGES/World Data Center for Paleoclimatology
Data Contribution Series #2005-007.
NOAA/NGDC Paleoclimatology Program, Boulder CO, USA.
ORIGINAL REFERENCE:
Chuine, I., P. Yiou, N. Viovy, B. Seguin, V. Daux, and E. Le Roy Ladurie. 2004.
Grape ripening as a past climate indicator.
Nature, Vol. 432, 18 November 2004.
ABSTRACT:
French records of grape-harvest dates in Burgundy were used to reconstruct spring-summer temperatures from 1370 to 2003 using a process-based phenology model
developed for the Pinot Noir grape. Our results reveal that temperatures as high as those reached in the 1990s have occurred several times in Burgundy
since 1370. However, the summer of 2003 appears to have been extraordinary, with temperatures that were probably higher than in any other year since 1370.
ADDITIONAL REFERENCE: Le Roy Ladurie, E. Histoire du Climat depuis l'An Mil.
Champs Flammarion, Paris, 1983.
PERIOD OF RECORD: 1370 - 2003 AD
Climate in Medieval Time
Raymond S. Bradley, Malcolm K. Hughes, Henry F. Diaz
Science, 302, 404-405.
 When was it warm? The warmest 30-year periods prior to 1970 A.D. from a variety of ice
core, tree ring, speleothem, sedimentary, and documentary records. Gray diamonds denote first year of record. 1: δ18O from Quelccaya Ice cap, Peru. 2: δ18O
from Sajama, Bolivia. 3: δ18O from Huascaran, Peru. 4: Inverted mean of eight tree-ring indices from northern Patagonia (Argentina and Chile). 5: Speleothem δ18O
from South Africa. 6: Austral summer temperatures from a New Zealand tree-ring series. 7: Tree-ring indices, Tasmania. 8: δD Talos Dome, Antarctica. 9: δ18O
from Guliya, W. China. 10: δ18O from Dunde, W. China. 11: δ18O from Dasuopu, W. China. 12: Summer temperature from three tree-ring series in the Sierra
Nevada, California. 13: Speleothem annual layer thickness, Beijing, China. 14:Winter temperatures from historical documents, E. China. 15: Lamination thickness
in lake sediments, Baffin Island, N. Canada. 16: Tree-ring indices from a site in Mongolia. 17: Mean annual temperature of Northern Hemisphere from multiproxy
composite. 18: Regional curve-standardized (RCS) temperature-sensitive tree-ring chronology from the Polar Urals. 19: RCS temperature-sensitive tree-ring
chronology from the Taimyr Peninsula. 20: RCS temperature-sensitive tree-ring chronology from Tornetrask, Northern Sweden. 21: Lake sediments, Ellesmere Island,
N. Canada. 22: δ18O from Summit (GISP2), C. Greenland. 23: Solar activity from 10Be.
When was it warm? The warmest 30-year periods prior to 1970 A.D. from a variety of ice
core, tree ring, speleothem, sedimentary, and documentary records. Gray diamonds denote first year of record. 1: δ18O from Quelccaya Ice cap, Peru. 2: δ18O
from Sajama, Bolivia. 3: δ18O from Huascaran, Peru. 4: Inverted mean of eight tree-ring indices from northern Patagonia (Argentina and Chile). 5: Speleothem δ18O
from South Africa. 6: Austral summer temperatures from a New Zealand tree-ring series. 7: Tree-ring indices, Tasmania. 8: δD Talos Dome, Antarctica. 9: δ18O
from Guliya, W. China. 10: δ18O from Dunde, W. China. 11: δ18O from Dasuopu, W. China. 12: Summer temperature from three tree-ring series in the Sierra
Nevada, California. 13: Speleothem annual layer thickness, Beijing, China. 14:Winter temperatures from historical documents, E. China. 15: Lamination thickness
in lake sediments, Baffin Island, N. Canada. 16: Tree-ring indices from a site in Mongolia. 17: Mean annual temperature of Northern Hemisphere from multiproxy
composite. 18: Regional curve-standardized (RCS) temperature-sensitive tree-ring chronology from the Polar Urals. 19: RCS temperature-sensitive tree-ring
chronology from the Taimyr Peninsula. 20: RCS temperature-sensitive tree-ring chronology from Tornetrask, Northern Sweden. 21: Lake sediments, Ellesmere Island,
N. Canada. 22: δ18O from Summit (GISP2), C. Greenland. 23: Solar activity from 10Be.
Climate Over Past Millennia
Climate Over Past Millennia.
IGBP PAGES/World Data Center for Paleoclimatology
Data Contribution Series #2004-085.
NOAA/NGDC Paleoclimatology Program, Boulder CO, USA.
ABSTRACT:
We review evidence for climate change over the past several millennia from instrumental and high-resolution climate "proxy" data sources and climate
modeling studies. We focus on changes over the past 1 to 2 millennia. We assess reconstructions and modeling studies analyzing a number of different climate
fields, including atmospheric circulation diagnostics, precipitation, and drought. We devote particular attention to proxy-based reconstructions of temperature
patterns in past centuries, which place recent large-scale warming in an appropriate longer-term context. Our assessment affirms the conclusion that late 20th
century warmth is unprecedented at hemispheric and, likely, global scales. There is more tentative evidence that particular modes of climate variability, such
as the El Nino/Southern Oscillation and the North Atlantic Oscillation, may have exhibited late 20th century behavior that is anomalous in a long-term context.
Regional conclusions, particularly for the Southern Hemisphere and parts of the tropics where high resolution proxy data are sparse, are more circumspect. The
dramatic differences between regional and hemispheric/global past trends, and the distinction between changes in surface temperature and precipitation/drought
fields, underscore the limited utility in the use of terms such as the "Little Ice Age" and "Medieval Warm Period" for describing past
climate epochs during the last millennium. Comparison of empirical evidence with proxy-based reconstructions demonstrates that natural factors appear to explain
relatively well the major surface temperature changes of the past millennium through the 19th century (including hemispheric means and some spatial patterns).
Only anthropogenic forcing of climate, however, can explain the recent anomalous warming in the late 20th century.
GEOGRAPHIC REGION: Global
PERIOD OF RECORD: 200 - 1995 AD
 We
begin with the individual instrumental series from figure
2c for Fennoscandia and Central Europe:
We
begin with the individual instrumental series from figure
2c for Fennoscandia and Central Europe:
 Moving
on to Western North America (fig 4a) we have:
Western US (Trees, Mann: years 200-1980); Northern Treeline (Trees, Jacoby: years 1601-1974); Western US Density (Trees, Briffa: years 1600-1982) and Jasper
(Trees, Luckman: years 1073-1987):
Moving
on to Western North America (fig 4a) we have:
Western US (Trees, Mann: years 200-1980); Northern Treeline (Trees, Jacoby: years 1601-1974); Western US Density (Trees, Briffa: years 1600-1982) and Jasper
(Trees, Luckman: years 1073-1987):
 As
might be expected, cold-sensitive northern tree line makes a faithful representation of the pattern seen in Arctic measures.
As
might be expected, cold-sensitive northern tree line makes a faithful representation of the pattern seen in Arctic measures.
 Europe (fig 4c) Tornetrask (Trees, Briffa, years 1-1993);
Polar Urals (Trees, Briffa, years 914-1990); Low Countries Annual (Documentary, van Engelen, years 1251-2000) and; Czech Rep. Annual (Documentary, Brazdil).
Europe (fig 4c) Tornetrask (Trees, Briffa, years 1-1993);
Polar Urals (Trees, Briffa, years 914-1990); Low Countries Annual (Documentary, van Engelen, years 1251-2000) and; Czech Rep. Annual (Documentary, Brazdil).
 The Low
Countries might offer some small support although the warmer periods early-18th and mid-19th Centuries rather trample allegations of
consistent cooling prior to abrupt contemporary warming.
The Low
Countries might offer some small support although the warmer periods early-18th and mid-19th Centuries rather trample allegations of
consistent cooling prior to abrupt contemporary warming.
 Eastern Asia (fig 4d) Mongolia (Trees, D'Arrigo)
 Over coming days we will extract series for other graphics
for which Jones and Mann have made their derived numbers available and perhaps other regions will prove instructive on the foundation of the infamous hockey
stick representation of the last millennium's temperature, at this stage it does not appear North America, Greenland, Europe nor Eastern Asia is very supportive
of such an assertion.
Over coming days we will extract series for other graphics
for which Jones and Mann have made their derived numbers available and perhaps other regions will prove instructive on the foundation of the infamous hockey
stick representation of the last millennium's temperature, at this stage it does not appear North America, Greenland, Europe nor Eastern Asia is very supportive
of such an assertion.
 Here's fig 4e: Tropics: In fact, it did not provide the
sought-after pronounced hockey stick shapes, oh well.
Here's fig 4e: Tropics: In fact, it did not provide the
sought-after pronounced hockey stick shapes, oh well.
Coastal Northern Norway Temperature Reconstruction
 Kirchhefer,
A.J., 2001,
Kirchhefer,
A.J., 2001,
Coastal Northern Norway Temperature Reconstruction.
International Tree-Ring Data Bank.
IGBP PAGES/World Data Center-A for Paleoclimatology
Data Contribution Series #2001-055.
NOAA/NGDC Paleoclimatology Program, Boulder CO, USA.
GEOGRAPHIC REGION: Coastal Northern Norway
PERIOD OF RECORD: 1358-1992 AD
DESCRIPTION:
Coastal Northern Norway (Lofoten/Vesterålen/Troms) tree ring July-August temperature reconstruction.
The chronologies used in the reconstruction and included in the files Norway_recon.xls and Norway_crn.txt are slightly different from the chronology files
NORW008.* - NORW010.* held in the International Tree Ring Data Bank. This is because some radii were treated individually (straight line if assumed that >100
rings were lacking from the inner part of the core).
Dendroclimatic reconstruction of June-July temperatures in northwestern Canada
 Szeicz, J.M. and
MacDonald, G.M., 1995,
Szeicz, J.M. and
MacDonald, G.M., 1995,
Dendroclimatic reconstruction of June-July temperatures in
northwestern Canada.
International Tree-Ring Data Bank. IGBP PAGES/World Data Center-A for Paleoclimatology Data Contribution Series # 95-024.
NOAA/NGDC Paleoclimatology Program, Boulder CO, USA.
GEOGRAPHIC REGION: Northwestern Canada
PERIOD OF RECORD: 1638-1988
DESCRIPTION:
These data are reconstructed June-July temperatures in northwestern Canada derived from tree-ring data.
Dendroclimatic reconstruction of June-July temperatures in northwestern Canada (calibrated with Dawson/Norman Wells average, 1909-1989), produced using
age-dependent modelling
General characteristics of temperature variation in China during the last two millennia.
 General
characteristics of temperature variation in China during the last two millennia
General
characteristics of temperature variation in China during the last two millennia
Geophysical Research Letters
10.1029/2001GL014485, 11 May 2002
Yang Bao
Institute of Cold and Arid Regions Environmental and Engineering, Chinese Academy of Sciences, China
Achim Braeuning
Institute for Geography, University of Stuttgart, Stuttgart, Germany
Kathleen R. Johnson
Department of Earth and Planetary Science, University of California, Berkeley, CA, USA
Yafeng Shi
Institute of Geography and Limnology, Chinese Academy of Sciences, Nanjing, China
ABSTRACT:
Three alternate China-wide temperature composites covering the last 2000 years were established by combining multiple paleoclimate proxy records obtained from
ice cores, tree rings, lake sediments and historical documents. Five periods of temperature variation can be identified: a warm stage in AD 0-240, a cold
interval between AD 240 and 800, a return to warm conditions from AD 800-1400, including the Medieval Warm Period between AD 800-1100, the cool Little Ice Age
period between 1400-1920, and the present warm stage since 1920. Regional temperature variation is found during AD 800-1100, when warm conditions occurred in
Eastern China and in the northeastern Tibetan Plateau and in AD 1150-1380, when the southern Tibetan Plateau experienced a warm interval. In contrast, evidence
for cool conditions during the LIA is more consistent among the proxy records. The temperature reconstructions for China and the Northern Hemisphere show good
agreement over the past millennium.
Historical Isotopic Temperature Record from the Vostok Ice Core
 Jouzel, J.,
C. Lorius, J.R. Petit, C. Genthon, N.I. Barkov, V.M. Kotlyakov, and V.M. Petrov. 1987. Vostok ice core: a continuous isotope temperature record over the last
climatic cycle (160,000 years). Nature 329:403-8.
Jouzel, J.,
C. Lorius, J.R. Petit, C. Genthon, N.I. Barkov, V.M. Kotlyakov, and V.M. Petrov. 1987. Vostok ice core: a continuous isotope temperature record over the last
climatic cycle (160,000 years). Nature 329:403-8.
Jouzel, J., N.I. Barkov, J.M. Barnola, M. Bender, J. Chappellaz, C. Genthon, V.M. Kotlyakov, V. Lipenkov, C. Lorius, J.R. Petit, D. Raynaud, G. Raisbeck, C.
Ritz, T. Sowers, M. Stievenard, F. Yiou, and P. Yiou. 1993. Extending the Vostok ice-core record of palaeoclimate to the penultimate glacial period. Nature
364:407-12.
Jouzel, J., C. Waelbroeck, B. Malaize, M. Bender, J.R. Petit, M. Stievenard, N.I. Barkov, J.M. Barnola, T. King, V.M. Kotlyakov, V. Lipenkov, C. Lorius, D.
Raynaud, C. Ritz, and T. Sowers. 1996. Climatic interpretation of the recently extended Vostok ice records. Climate Dynamics 12:513-521.
Petit, J.R., J. Jouzel, D. Raynaud, N.I. Barkov, J.-M. Barnola, I. Basile, M. Bender, J. Chappellaz, M. Davis, G. Delayque, M. Delmotte, V.M. Kotlyakov, M.
Legrand, V.Y. Lipenkov, C. Lorius, L. Pepin, C. Ritz, E. Saltzman, and M. Stievenard. 1999. Climate and atmospheric history of the past 420,000 years from the
Vostok ice core, Antarctica. Nature 399: 429-436.
Kathmandu, Nepal Temperature Reconstructions
 Cook, E.R., et al.,
2003,
Cook, E.R., et al.,
2003,
Kathmandu, Nepal Temperature Reconstructions,
IGBP PAGES/World Data Center for Paleoclimatology
Data Contribution Series #2003-038.
NOAA/NGDC Paleoclimatology Program, Boulder CO, USA.
GEOGRAPHIC REGION: Himalayas
PERIOD OF RECORD: 1546 - 1991 AD
ABSTRACT:
We describe the development of a tree-ring chronology network in Nepal that is suitable for reconstructing temperature-related climate forcing over the past few
hundred years. The network is composed of 32 tree-ring chronologies and is represented by five indigenous tree species. An empirical orthogonal function
analysis of the chronologies over the common interval 1796-92 indicates the existence of coherent large-scale signals among the tree-ring chronologies that are
hypothesized to reflect, in part, broad-scale climate forcing related to temperatures. A long monthly temperature record for Kathmandu is developed and used to
test this hypothesis. In so doing, significant monthly and seasonal temperature responses are identified that provide guidance for the formal reconstruction of
two temperature seasons: February-June (1546-91) and October-February (1605-91). Each reconstruction indicates the occurrence of unusually cold temperatures in
1815-22, which coincides with the eruption of Tambora in Indonesia. A novel method is also used to add probable missing multi-centennial temperature variance to
each reconstruction. The resulting adjusted reconstructions strongly reflect patterns of temperature variability associated with Little Ice Age cooling and
warming into the 20th century, with the October-February season exhibiting the strongest increase in temperature over the past 400 years. Only the
October-February season shows any evidence for late- 20th century warming, whereas February-June temperatures have actually cooled since 1960 (as with the
observational series).
Lake Malawi TEX86 Surface Temperature Reconstruction
 Powers,
L.A., et al.. 2005.
Powers,
L.A., et al.. 2005.
Lake Malawi TEX86 Surface Temperature Reconstruction.
IGBP PAGES/World Data Center for Paleoclimatology
Data Contribution Series # 2005-038.
NOAA/NCDC Paleoclimatology Program, Boulder CO, USA.
ABSTRACT:
The role of the tropics in global climate change is actively debated, particularly in regard to the timing and magnitude of thermal and hydrological response.
Continuous, high-resolution temperature records through the Last Glacial Maximum (LGM) from tropical oceans have provided much insight but surface temperature
reconstructions do not exist from tropical continental environments. Here we used the TEX86 paleotemperature proxy to reconstruct mean annual lake surface
temperatures through the Last Glacial Maximum (LGM) in Lake Malawi, East Africa (9º-14ºS). We find a ~3.5ºC overall warming since the LGM, with temperature
reversals of ~ 2ºC during the Younger Dryas (12.5 ka BP) and at 8.2 ka BP. Maximum Holocene temperatures of ~29ºC were found at 5 ka BP, a period preceding
severe drought in Africa. These results suggest a substantial thermal response of southeastern tropical Africa to deglaciation and to varying conditions during
the Holocene.
GEOGRAPHIC REGION: Tropical East Africa
PERIOD OF RECORD: 24 KYrBP - present
Lake Victoria High-Resolution Diatom-Based Conductivity Reconstruction
 Stager,
J.C., et al. 2005.
Stager,
J.C., et al. 2005.
Lake Victoria High-Resolution Diatom-Based Conductivity
Reconstruction.
IGBP PAGES/World Data Center for Paleoclimatology
Data Contribution Series # 2005-040.
NOAA/NCDC Paleoclimatology Program, Boulder CO, USA.
ABSTRACT:
A new diatom series with 1–6 year resolution from Lake Victoria, East Africa, shows that lake level minima occurred ca. 820–760, 680–660, 640–620,
370–340, and 220–150 calendar years BP. Inferred lake levels were exceptionally high during most of the Little Ice Age (ca. 600–200 calendar years BP).
Synchrony between East African high lake levels and prolonged sunspot minima during much of the last millenium may reflect solar variability's effects on
tropical rainfall, but those relationships reversed sign ca. 200 years ago. Historical records also show that Victoria lake levels rose during every peak of the
ca. 11-year sunspot cycle since the late 19th century. These findings suggest that, if these apparent tropical sun–climate associations during the last
millenium were real, then they were subject to abrupt sign reversals.
GEOGRAPHIC REGION: East Africa
PERIOD OF RECORD: ~1000 - 1970 AD
Little Ice Age Summer Temperatures and Annual Precipitation for Northeastern and Northcentral United States.
World Data Center-A for Paleoclimatology Data Contribution Series # 93-001.
NOAA/NGDC Paleoclimatology Program, Boulder CO, USA.
GEOGRAPHIC REGION: NorthEast USA
PERIOD OF RECORD: 0 - 2,000 YBP
DESCRIPTION:
Mean summer (JJA) temperatures and Total annual precipitation for the past 2000 years reconstructed from pollen from lakes with laminated sediments. The
laminations ensure a more precise time control than normally obtained from radiocarbon.
Moon Lake Diatom Salinity-Drought Data.
 Laird, K.R. et
al, 1998
Laird, K.R. et
al, 1998
Moon Lake Diatom Salinity-Drought Data
GEOGRAPHIC REGION: Northern Great Plains, USA and Canada
PERIOD OF RECORD: 350 BC - 1980 AD
DESCRIPTION:
Drought intensity and frequency on the Great Plains of North America
inferred from Diatom derived salinity reconstructions in Moon Lake,
North Dakota, USA (46 51' 27" N, 98 09' 30" W. ~35 ha, max. depth ~13m).
Reconstructed extreme droughts are more frequent before 1200 AD.
Moon Lake 11,000 Year Diatom-inferred Salinity Data
 Laird,
K.R., et al., 2003,
Laird,
K.R., et al., 2003,
Moon Lake 11,000 Year Diatom-inferred Salinity
Data,
IGBP PAGES/World Data Center for Paleoclimatology
Data Contribution Series #2003-030.
NOAA/NGDC Paleoclimatology Program, Boulder CO, USA.
GEOGRAPHIC REGION: Northern Great Plains, USA and Canada
PERIOD OF RECORD: 11 KYrBP - present
ABSTRACT:
Estimates of past lake-water salinity from fossil diatom assemblages were used to infer past climatic conditions at Moon Lake, a climatically sensitive site in
the northern Great Plains. A good correspondence between diatom-inferred salinity and historical records of mean annual precipitation minus
evapotranspiration (P-ET) strongly suggests that the sedimentary record from Moon Lake can be used to reconstruct past climatic conditions. Century-scale
analysis of the Holocene diatom record indicates four major hydrological periods: an early Holocene transition from an open freshwater system to a closed saline
system by 7300 BP, which corresponds with a transition from spruce forest to deciduous parkland to prairie and indicates a major shift from wet to dry climate;
a mid-Holocene period of high salinity from 7300 to 4700 BP, indicating low effective moisture (P-ET); a transitional period of high salinity 4700 to 2200 BP,
characterized by poor diatom preservation; and a late Holocene period of variable lower salinity during the past 2,200 years, indicating fluctuations in
effective moisture.
Northern Hemisphere Temperature Reconstructions
 Briffa, et al,
1998,
Briffa, et al,
1998,
Northern Hemisphere Temperature Reconstructions.
IGBP PAGES/World Data Center-A for Paleoclimatology
Data Contribution Series #98-022.
NOAA/NGDC Paleoclimatology Program, Boulder CO, USA.
GEOGRAPHIC REGION: Northern Hemisphere
PERIOD OF RECORD: 1400-1994 A.D.
DESCRIPTION:
The data consists of two timeseries representative of Northern Hemisphere growing season temperatures for the period 1400-1994, derived from means of 383
maximum latewood density chronologies from the northern Boreal forest. Both series are given in dimensionless standardised anomalies, and one has also been
rescaled to give an estimate of Northern Hemisphere land and marine temperature anomalies.
Northern Hemisphere Temperature Reconstruction
 Crowley and Lowery
2000 (Ambio 29, 51)
Crowley and Lowery
2000 (Ambio 29, 51)
Northern Hemisphere Temperature Reconstruction
Modified as published in Crowley 2000
Causes of Climate Change Over the Past 1000 Years
Thomas J. Crowley
Recent reconstructions of Northern Hemisphere temperatures and climate forcing over the past 1000 years allow the warming of the 20th century to be placed
within a historical context and various mechanisms of climate change to be tested. Comparisons of observations with simulations from an energy balance climate
model indicate that as much as 41 to 64% of preanthropogenic (pre-1850) decadal-scale temperature variations was due to changes in solar irradiance and
volcanism. Removal of the forced response from reconstructed temperature time series yields residuals that show similar variability to those of control runs of
coupled models, thereby lending support to the models' value as estimates of low-frequency variability in the climate system. Removal of all forcing except
greenhouse gases from the ~1000-year time series results in a residual with a very large late-20th-century warming that closely agrees with the response
predicted from greenhouse gas forcing. The combination of a unique level of temperature increase in the late 20th century and improved constraints on the role
of natural variability provides further evidence that the greenhouse effect has already established itself above the level of natural variability in the climate
system. A 21st-century global warming projection far exceeds the natural variability of the past 1000 years and is greater than the best estimate of global
temperature change for the last interglacial.)
Data from Fig. 1, Crowley 2000:
Decadally smoothed time series of Crowley-Lowery reconstruction spliced into smoothed Jones et al instrumental record after 1860 (labeled CL2.Jns11), and a
slight modification (labeled CL2) of the original Crowley and Lowery reconstruction to 1965.
Northern Hemisphere Temperature Reconstructions Compared
 Briffa and
Crowley exhibit significant anomalies over the last half-millennia's temperature reconstruction and the appended Mann instrumental is startling, to say the
least. A major difficulty arises when all three are simultaneously plotted in that the only real agreement, accidental or otherwise, occurs for a few decades in
the first half of the 20th Century, with instrument and tree ring analyses taking opposing signs for latter 20th Century trend. Two
immediate possibilities present themselves. Firstly, it is entirely possible and plausible that tree growth is a less than dazzling temperature proxy (growth
could be inhibited by conditions too cold, too hot, too dry, too wet...) - this would suggest we know a lot less than we think we do about past conditions and
temperatures. Secondly, it is equally possible and plausible that the temperature record measures urbanisation and the heat island effect to a greater extent
than currently allowed for and that the trees reflect global temperatures while the instruments reflect urban temperatures - this would suggest that some
or all of the warming that causes such alarm is in fact an artefact of measurement rather than of fact.
Briffa and
Crowley exhibit significant anomalies over the last half-millennia's temperature reconstruction and the appended Mann instrumental is startling, to say the
least. A major difficulty arises when all three are simultaneously plotted in that the only real agreement, accidental or otherwise, occurs for a few decades in
the first half of the 20th Century, with instrument and tree ring analyses taking opposing signs for latter 20th Century trend. Two
immediate possibilities present themselves. Firstly, it is entirely possible and plausible that tree growth is a less than dazzling temperature proxy (growth
could be inhibited by conditions too cold, too hot, too dry, too wet...) - this would suggest we know a lot less than we think we do about past conditions and
temperatures. Secondly, it is equally possible and plausible that the temperature record measures urbanisation and the heat island effect to a greater extent
than currently allowed for and that the trees reflect global temperatures while the instruments reflect urban temperatures - this would suggest that some
or all of the warming that causes such alarm is in fact an artefact of measurement rather than of fact.
Pre-instrumental climate: how has climate varied during the past 500 years?
There is, unanimity in the available historical reconstruction, that the 2Oth-ceotury Warming is unique in the context of the last 500 years. and it is
necessary to go back to the early 15th and 14th century, (1330-1450) to find evidence of temperatures similar to, or higher than, in recent decades. However. it
is worth noting that many historical indices (particularly those currently available from East Asia) are based largely on the occurrence of extreme cold events,
and the absence of such extremes does not necessarily imply unusually warm conditions. It is thus difficult to assess from these data whether temperatures ever
reached 20th-century levels during the 18th and 16th centuries when conditions appear to have been "less severe" than at other times. Individual years
in some areas clearly stand out as exceptionally warm (e.g.. in Europe: 1540, 1473, 1420, 1336, 1331, 1270; Pfister, 1988), but whether these anomalies were
only regional, or of more global, significance is not known at present. In fact, a comparison of individual year, and decades from one region to another often
,how, little consistency in the magnitude, or oven the sign of the anomalies. This is partly due to the use of different reference periods and because
reconstructions are generally presented as a running mean, in an attempt to smooth over the inadequacies of converting historical records to quantitative
temperature estimates. Nevertheless there appears to be a consistent signal from many regions that the 1690s the 1810s and 1820s and the 1890s were
exceptionally cold in the context of the last 500 years. Indeed, in many areas, almost the entire 19th century was cold, in stark contrast to conditions which
have developed in the subsequent 100 years. Attention should be focussed on identifying when temperatures were similar to 20th-century averages; in general
terms it appears that such conditions have not prevailed for at least 400 years, though individual years and perhaps even decades (e.g., 1730s, 1780-1805)
during the last 500 years may have been relatively warm, in some, if not all, seasons. Overall, interdecadal temperature fluctuation, do not appear to have been
more than ±1°C seasonally in most regions although the rise in temperature from the low levels of the 1810s to the high point of the 1980s may be around +2°C
in mean-annual temperature for many regions. There is little prospect of reconstructing, from historical data alone, a hemispherically representative record of
temperature for the last 500 years without a significant increase in information about paleotemperature conditions in the tropics. There is even less hope of
reconstructing southern hemisphere paleotemperatures from historical data since the written records are fewer and shorter, and the oceanic areas are so much
more extensive. The best prospect for paleotemperature reconstruction over the past few centuries lies in the combined use of several different types of proxy
data, to include historical data, tree-growth indices, ice-core data and sedimentary deposits. Only with such an approach can the required geographical coverage
be achieved and the results from the many diverse approaches to paleoclimatic reconstruction be tested against each other.
Southeast Pacific High Resolution Alkenone SST Reconstruction
 Kaiser,
J., et al. 2005.
Kaiser,
J., et al. 2005.
Southeast Pacific High Resolution Alkenone SST Reconstruction.
IGBP PAGES/World Data Center for Paleoclimatology
Data Contribution Series # 2005-073.
NOAA/NCDC Paleoclimatology Program, Boulder CO, USA.
ORIGINAL REFERENCE: Kaiser, J., F. Lamy, and D. Hebbeln. 2005.
A 70-kyr sea surface temperature record off southern Chile
(Ocean Drilling Program Site 1233).
Paleoceanography, Vol. 20, PA4009, doi:10.1029/2004PA001146
ABSTRACT: We present the first high-resolution alkenone-derived sea surface temperature (SST) reconstruction in the southeast Pacific (Ocean Drilling Program
Site 1233) covering the major part of the last glacial period and the Holocene. The record shows a clear millennial-scale pattern that is very similar to
climate fluctuations observed in Antarctic ice cores, suggesting that the Southern Hemisphere high-latitude climate changes extended into the midlatitudes,
involving simultaneous changes in air temperatures over Antarctica, sea ice extent, extension of the Antarctic Circumpolar Current, and westerly atmospheric
circulation. A comparison to other midlatitude surface ocean records suggests that this "Antarctic" millennial-scale pattern was probably a
hemisphere-wide phenomenon. In addition, we performed SST gradient reconstructions over the complete latitudinal range of the Pacific Eastern Boundary Current
System for different time intervals during the last 70 kyr. The main results suggest an equatorward displaced subtropical gyre circulation during marine isotope
stages 2 and 4.
GEOGRAPHIC REGION: Southeast Pacific
PERIOD OF RECORD: 70 KYrBP - present
Southern Colorado Plateau Temperature and Precipitation Reconstructions.
 Salzer, M.W. and K.F.
Kipfmueller. 2005.
Salzer, M.W. and K.F.
Kipfmueller. 2005.
Southern Colorado Plateau Temperature and
Precipitation Reconstructions.
IGBP PAGES/World Data Center for Paleoclimatology
Data Contribution Series # 2005-066.
NOAA/NCDC Paleoclimatology Program, Boulder CO, USA.
ABSTRACT:
Two independent calibrated and verified climate reconstructions from ecologically contrasting tree-ring sites in the southern Colorado Plateau, U.S.A. reveal
decadal-scale climatic trends during the past two millennia. Combining precisely dated annual mean-maximum temperature and October through July precipitation
reconstructions yields an unparalleled record of climatic variability. The approach allows for the identification of thirty extreme wet periods and thirty-five
extreme dry periods in the 1,425-year precipitation reconstruction and 30 extreme cool periods and 26 extreme warm periods in 2,262-year temperature
reconstruction. In addition, the reconstructions were integrated to identify intervals when conditions were extreme in both climatic variables (cool/dry,
cool/wet, warm/dry, warm/wet). Noteworthy in the reconstructions are the post-1976 warm/wet period, unprecedented in the 1,425-year record both in amplitude and
duration, anomalous and prolonged late 20th century warmth, that while never exceeded, was nearly equaled in magnitude for brief intervals in the past, and
substantial decadal-scale variability within the Medieval Warm Period and Little Ice Age intervals.
GEOGRAPHIC REGION: Southern Colorado Plateau, USA
PERIOD OF RECORD: 250 BC - 1996 AD
Spannagel Cave Stalagmite Oxygen Isotope Data and Temperature Reconstruction
 Mangini, A.,
et al. 2005.
Mangini, A.,
et al. 2005.
Spannagel Cave Stalagmite Oxygen Isotope Data and Temperature Reconstruction.
IGBP PAGES/World Data Center for Paleoclimatology
Data Contribution Series #2005-052.
NOAA/NGDC Paleoclimatology Program, Boulder CO, USA.
The precisely dated isotopic composition of a stalagmite from Spannagel Cave in the Central Alps is translated into a highly resolved record of temperature at
high elevation during the past 2000 yr. Temperature maxima during the Medieval Warm Period between 800 and 1300 AD are in average about 1.7°C higher than the
minima in the Little Ice Age and similar to present-day values. The high correlation of this record to d14C suggests that solar variability was a major driver
of climate in Central Europe during the past 2 millennia.
Spring/Summer Gulf of Alaska Temperature Reconstructions
 Wiles, G., D'Arrigo, R.,
and Jacoby, G.C., 1999,
Wiles, G., D'Arrigo, R.,
and Jacoby, G.C., 1999,
Spring/Summer Gulf of Alaska Temperature
Reconstructions.
International Tree-Ring Data Bank.
IGBP PAGES/World Data Center-A for Paleoclimatology
Data Contribution Series #1999-045.
NOAA/NGDC Paleoclimatology Program, Boulder CO, USA.
GEOGRAPHIC REGION: Gulf of Alaska/Northwest North America
PERIOD OF RECORD: 1600-1990
DESCRIPTION:
Spring temperatures (March-May) reconstructed for the Gulf of Alaska, 1600-1990.
Reconstruction based on ring-width chronologies. Models are calibrated with a regional average of coastal weather stations along the Gulf of Alaska.
Tasmania Temperature Reconstruction
 Cook,
E.R., D'Arrigo, R.D., and Buckley, B.M., 1998,
Cook,
E.R., D'Arrigo, R.D., and Buckley, B.M., 1998,
Tasmania Temperature Reconstruction. International Tree-Ring Data Bank.
IGBP PAGES/World Data Center-A for Paleoclimatology Data Contribution Series #98-040.
NOAA/NGDC Paleoclimatology Program, Boulder CO, USA.
DESCRIPTION:
3,592 year warm season (November-April) temperature reconstruction for Tasmania,
derived from Huon Pine on Mt. Read.
File Tasmania.recon.txt contains two time series labeled ARFILT and ORIGINAL.
ORIGINAL is derived using all ring width data, including years of known summer freeze events which resulted in 5-8 years of growth suppression.
ARFILT removes these outliers due to known or presumed summer freeze events, and is believed to be the more accurate climatic reconstruction.
Temperature in central Greenland
 Alley, R.B.. 2004.
GISP2 Ice Core Temperature and Accumulation Data.
IGBP PAGES/World Data Center for Paleoclimatology
Data Contribution Series #2004-013.
NOAA/NGDC Paleoclimatology Program, Boulder CO, USA.
Temperature interpretation based on stable isotope analysis, and ice accumulation data, from the GISP2 ice core, central Greenland.
Data are smoothed from original measurements published by Cuffey and Clow (1997), as presented in Figure 1 of Alley (2000).
ABSTRACT:
Greenland ice-core records provide an exceptionally clear picture of many aspects of abrupt climate changes, and particularly of those associated with the
Younger Dryas event, as reviewed here. Well-preserved annual layers can be counted confidently, with only 1% errors for the age of the end of the Younger Dryas
11,500 years before present. Ice-flow corrections allow reconstruction of snow accumulation rates over tens of thousands of years with little additional
uncertainty. Glaciochemical and particulate data record atmospheric-loading changes with little uncertainty introduced by changes in snow accumulation.
Confident paleothermometry is provided by site-specific calibrations using ice-isotopic ratios, borehole temperatures, and gas-isotopic ratios.
Near-simultaneous changes in ice-core paleoclimatic indicators of local, regional, and more-widespread climate conditions demonstrate that much of the Earth
experienced abrupt climate changes synchronous with Greenland within thirty years or less. Post-Younger Dryas changes have not duplicated the size, extent and
rapidity of these paleoclimatic changes.
The Little Ice Age and Medieval Warm Period in the Sargasso Sea
 The adjacent graphic is from the decade-old
(and pre-PC) The Little Ice Age and Medieval Warm Period in the Sargasso Sea - "Sea
surface temperature (SST), salinity, and flux of terrigenous material oscillated on millennial time scales in the Pleistocene North Atlantic, but there are few
records of Holocene variability. Because of high rates of sediment accumulation, Holocene oscillations are well documented in the northern Sargasso Sea. Results
from a radiocarbon-dated box core show that SST was ~1 °C cooler than today ~400 years ago (the Little Ice Age) and 1700 years ago, and ~1 °C warmer
than today 1000 years ago (the Medieval Warm Period). Thus, at least some of the warming since the Little Ice Age appears to be part of a natural
oscillation." (Lloyd D. Keigwin, Science, 274: 1503-1508)
The adjacent graphic is from the decade-old
(and pre-PC) The Little Ice Age and Medieval Warm Period in the Sargasso Sea - "Sea
surface temperature (SST), salinity, and flux of terrigenous material oscillated on millennial time scales in the Pleistocene North Atlantic, but there are few
records of Holocene variability. Because of high rates of sediment accumulation, Holocene oscillations are well documented in the northern Sargasso Sea. Results
from a radiocarbon-dated box core show that SST was ~1 °C cooler than today ~400 years ago (the Little Ice Age) and 1700 years ago, and ~1 °C warmer
than today 1000 years ago (the Medieval Warm Period). Thus, at least some of the warming since the Little Ice Age appears to be part of a natural
oscillation." (Lloyd D. Keigwin, Science, 274: 1503-1508)
The Sun is More Active Now than Over the Last 8000 Years
 The activity of the Sun over the last 11,400 years, i.e., back to the end of the last ice age on Earth, has now for
the first time been reconstructed quantitatively by an international group of researchers led by Sami K. Solanki from the Max Planck Institute for Solar System
Research (Katlenburg-Lindau, Germany). The scientists have analyzed the radioactive isotopes in trees that lived thousands of years ago. As the scientists from
Germany, Finland, and Switzerland report in the current issue of the science journal "Nature" from October 28, one needs to go back over 8,000 years
in order to find a time when the Sun was, on average, as active as in the last 60 years. Based on a statistical study of earlier periods of increased solar
activity, the researchers predict that the current level of high solar activity will probably continue only for a few more decades.
The activity of the Sun over the last 11,400 years, i.e., back to the end of the last ice age on Earth, has now for
the first time been reconstructed quantitatively by an international group of researchers led by Sami K. Solanki from the Max Planck Institute for Solar System
Research (Katlenburg-Lindau, Germany). The scientists have analyzed the radioactive isotopes in trees that lived thousands of years ago. As the scientists from
Germany, Finland, and Switzerland report in the current issue of the science journal "Nature" from October 28, one needs to go back over 8,000 years
in order to find a time when the Sun was, on average, as active as in the last 60 years. Based on a statistical study of earlier periods of increased solar
activity, the researchers predict that the current level of high solar activity will probably continue only for a few more decades.
Studies at the Max Planck Institute for Solar System Research reveal: solar activity affects the climate but plays only a minor role in the current global
warming
Since the middle of the last century, the Sun is in a phase of unusually high activity, as indicated by frequent occurrences of sunspots, gas eruptions, and
radiation storms. Researchers at the Max Planck Institute for Solar System Research (MPS) in Katlenburg-Lindau (Germany) and at the University of Oulu (Finland)
have come to this conclusion after they have succeeded in reconstructing the solar activity based on the sunspot frequency since 850 AD. To this end, they have
combined historical sunspot records with measurements of the frequency of radioactive isotopes in ice cores from Greenland and the Antarctic. As the scientists
have reported in the renowned scientific journal, Physical Review Letters, since 1940 the mean sunspot number is higher than it has ever been in the last
thousand years and two and a half times higher than the long term average. The temporal variation in the solar activity displays a similarity to that of the
mean temperature of the Earth. These scientific results therefore bring the influence of the Sun on the terrestrial climate, and in particular its contribution
to the global warming of the 20th century, into the forefront of current interest. However, researchers at the MPS have shown that the Sun can be responsible
for, at most, only a small part of the warming over the last 20-30 years. They took the measured and calculated variations in the solar brightness over the last
150 years and compared them to the temperature of the Earth. Although the changes in the two values tend to follow each other for roughly the first 120 years,
the Earth’s temperature has risen dramatically in the last 30 years while the solar brightness has not appreciably increased in this time.
Yamal Peninsula Multimillennial Summer Temperature Reconstruction
 Hantemirov, R.M. and S.G.
Shiyatov, 2003,
Hantemirov, R.M. and S.G.
Shiyatov, 2003,
Yamal Peninsula Multimillennial Summer Temperature
Reconstruction
IGBP PAGES/World Data Center for Paleoclimatology
Data Contribution Series # 2003-029.
NOAA/NGDC Paleoclimatology Program, Boulder CO, USA.
ABSTRACT:
Remains of subfossil Siberian larch trees in the Holocene deposits of the Yamal Peninsula (Western Siberia) have been collected in order to develop a
continuous, multimillennium tree-ring-width chronology. This work has produced a calendar-age dated 4000-year (2000 BC to AD 1996) series. From these data,
summer-temperature variability in this region has been estimated on annual to multidecadal timescales. Radiocarbon dating of selected older material shows that
the oldest subfossil wood is 9400 years old and the dates of the sampled material are generally distributed evenly through time. It will, therefore, be possible
to develop a tree-ring chronology for more than nine millennia. An initial assessment of long-term fluctuations in Yamal summer warmth has been realized through
the reconstruction of tree-line dynamics using a combination of dendrochronological (absolute) dated material and less precisely (radiocarbon) dated older
subfossils.
 GEOGRAPHIC REGION: Northwestern Siberia
PERIOD OF RECORD: 2067 BC - 1996 AD
"Hockey Stick":
Michael E. Mann, Raymond S. Bradley & Malcolm K. Hughes
Spatially resolved global reconstructions of annual surface temperature patterns over the past six centuries are based on the multivariate calibration of widely
distributed high-resolution proxy climate indicators. Time-dependent correlations of the reconstructions with time-series records representing changes in
greenhouse-gas concentrations, solar irradiance, and volcanic aerosols suggest that each of these factors has contributed to the climate variability of the past
400 years, with greenhouse gases emerging as the dominant forcing during the twentieth century. Northern Hemisphere mean annual temperatures for three of the
past eight years are warmer than any other year since (at least) AD 1400.
 The
"Hockey Stick" graph, along with its seemingly immediate and rapturous adoption by the IPCC, is certainly contentious although few have been
sufficiently adventurous to challenge the orthodoxy by kicking the tires and checking under the hood of this modern bandwagon (brief description of some of
those who have here and here). Such reticence is
understandable given the defence mounted by advocates of the new climate paradigm, their cheer squad and acolytes. Members of these somewhat exclusive groups
(the "hockey team", "high stickers" and sometimes a few less benevolent names) talk to each other (preach to the choir?) on a blog called
"RealClimate.org". They do post some interesting items (such as questions on GCMs) although
readers should be aware that dissent or open inquiry is not encouraged and the site is moderated with a heavy hand.
The
"Hockey Stick" graph, along with its seemingly immediate and rapturous adoption by the IPCC, is certainly contentious although few have been
sufficiently adventurous to challenge the orthodoxy by kicking the tires and checking under the hood of this modern bandwagon (brief description of some of
those who have here and here). Such reticence is
understandable given the defence mounted by advocates of the new climate paradigm, their cheer squad and acolytes. Members of these somewhat exclusive groups
(the "hockey team", "high stickers" and sometimes a few less benevolent names) talk to each other (preach to the choir?) on a blog called
"RealClimate.org". They do post some interesting items (such as questions on GCMs) although
readers should be aware that dissent or open inquiry is not encouraged and the site is moderated with a heavy hand.