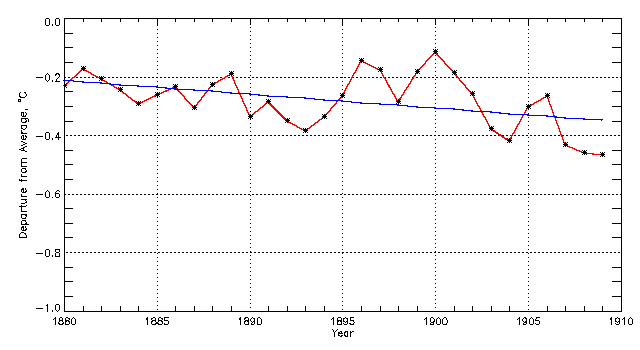
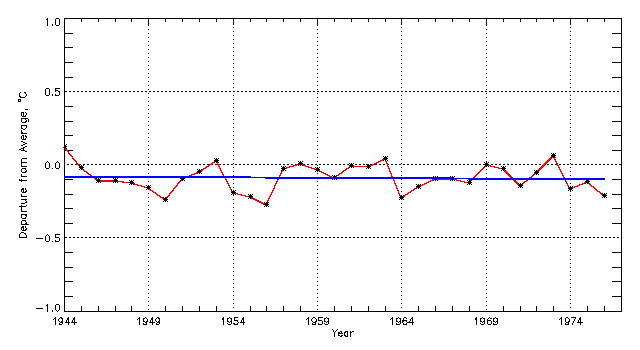
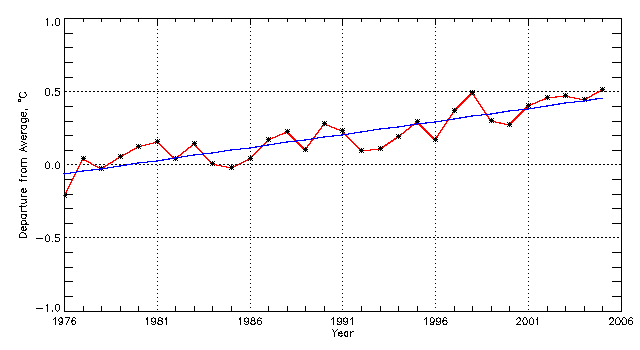
The Real Carbon Footprint CalculatorBy request, here is the support data for The Real Carbon Footprint Calculator as a separate file (as would be displayed below the calculated results -- click here to open the actual calculator in another tab/window) ... calculation would be here, eg US Millennium Indicator 2002: 'Carbon dioxide emissions (CO2), metric tons of CO2 per capita (CDIAC)' of 20.1mt would yield a result of 0.0000000000156 °F, UK's 9.2mt: 0.0000000000040 °C... Alright, we admit it, we lied! You aren't really 'saving' anything like that much potential warming. Let's go through the calculation to see why not (see our Greenhouse Primer if you find items you don't understand or can't see why they are mentioned): To begin with we simply divided the globe's estimated temperature increase by the amount of atmospheric carbon increase since the Industrial Revolution (we'll expand on this with numbers shortly but, for now, let's just make it nice and easy for those grappling with the concept). All we are talking about is the amount of extra carbon in the atmosphere since the Industrial Revolution, divided by the estimated temperature increase to derive what's called a linear response rate. This means assuming that every extra ton of atmospheric carbon has an identical effect on global temperature, giving us a straight line (linear) per-ton temperature response. This figure is then multiplied by the persistent portion of your offset emissions -- the persistent portion means the fraction of your emission that actually remains in the atmosphere rather than being absorbed by the neighbor's begonia, or whatever. This overstates your savings estimate once by assuming a linear temperature response as we said above -- it's actually logarithmic, meaning there is a diminishing effect as atmospheric carbon increases -- think of our calculation as grade inflation. Then this calculation further overstates your savings estimate by using the inflated time series: Temperature January-December, 1880 - 2005 GHCN Land Surface Data Set -- Global Trend: 0.07 °C/decade (12.5 decades @ 0.07 °C/decade = 0.875 °C) (warning, very slow links -- note that the following GCAG links may require 20-40 seconds for seasonal and annual calculations, please be patient, they'll load in a new page while you continue here). Note that is almost double the global trend: Temperature January-December, 1880 - 2005 GHCN-ERSST Data Set Global Trend: 0.04 °C/decade (total 0.5 °C). Sidebar: the IPCC says the globe has warmed by 0.6 °C ± 0.2 °C during the Twentieth Century and, since this omits a few decades prior cooling, yields a virtually identical trend (see GHCN-ERSST [century total 0.5 °C] and HadCRUT2v [0.6 °C]). Discovering that the global temperature trend and net increment is so low frequently causes great confusion because everyone has been subjected to media bombardment with claims about dramatic warming at outrageous rates (specified over ridiculously short periods), complete with disaster prognostication and images of a red-tinted planet. Such claims are pure theater since, while there is a loose association between rising atmospheric carbon dioxide and rising global mean temperature, association is not causation. Following the Industrial Revolution atmospheric carbon has increased steadily in what might be considered two phases, pre and post World War II, in the first phase about 0.1% per year will produce a fair approximation and in the subsequent era of serious reconstruction and development it has been pushed up to around 0.4% per year. Earth's temperature, however, has varied in four distinct phases of roughly three decades each, two of warming (2nd & 4th) and two not (1st & 3rd). Below we present time series from the merged land air & sea surface temperature dataset (GHCN-ERSST) and the slightly longer gridded land & ocean dataset developed at the Climatic Research Unit in the United Kingdom (HadCRUTv2). While they have trivial disagreements, such as whether 1908 or 1909 was the coolest year of the early Twentieth Century, they are in close agreement with the greatest discrepancy attributable to different record commencement dates:
On examination of more complete series than the "since the seventies" or "over the last three decades" presented by the media and pressure groups doing science-by-press-release, the simplistic association of increased atmospheric carbon and global mean temperature becomes much more problematic. The physics of atmospheric carbon compounds do not change at roughly three-decadal intervals so the obvious conclusion is that some other influence is affecting or creating the apparent trends. We know this to be true because these four phases are superimposed over a background of two sets of near-linear atmospheric carbon increase and we know carbon compounds do not alter their properties according to calendar year. If atmospheric carbon were the principal driver of global temperature change we would expect to detect a consistent logarithmic temperature increment but this has not occurred. Additionally, our reference or temperature baseline is coming from a time of uncomfortable cold, at least in Europe where many of the longer thermometric records are based, a time of hardship and poor crops. Why such a temperature range should be deemed exceptionally desirable is a mystery but we have no means of determining the mean temperature of that period as being either "normal" or optimal. One final note before we move on, IPCC climate model runs assume a much higher atmospheric carbon dioxide increment of 1% per annum and include dramatic increases in the more potent greenhouse gas, methane (CH4), the rise of which actually tapered off over the latter Twentieth Century and which has been in apparent equilibrium for about the last decade. These models also include almost maniacal sensitivity to atmospheric carbon, the net result of which, when coupled with fanciful future atmospheric carbon increment, is to produce quite alarming and physically quite dubious estimations of potential future warming. Knowing this, why are we using the land only series rather than the merged land and sea surface temperature data, when the land only set gives an inflated impression of warming and is likely seriously influenced by Urban Heat Island Effect? Two reasons really: Firstly, we tried out the calculator on test users and found people had trouble juggling too many leading zeros. Unfortunately, by limiting output to The second reason is purely selfish. JunkScience.com has been trying to keep the focus on science and reality for a decade now and we know from tedious experience that every warming hand-wringer and conspiracy theorist will be baying at the moon and flooding our mail boxes with complaint and accusation if we don't use the maximum estimate -- this despite the lesser trend number being the best available product from an IPCC-approved, publicly funded, global data repository. By using the land surface only numbers, even though we know them to be excessive, we avoid all the claims of "it's really much higher -- the oceans are hiding the warming..." and similar ancillary distractions. Returning to the calculation at hand, in reality there should probably be a couple or three more zeros after the decimal point but some people become kind of depressed at the thought of having to go to 15 places to get on the board and it is really not worth the effort having advocates argue over whether we should publish in So, exactly how did we come up with the figures above? Let's walk through the assumptions and calculations in actual numbers, then we'll wrap up with the numbers required to save 1 °C assuming a linear response: According to the Carbon Dioxide Information Analysis Center (CDIAC), 1 ppmv of atmospheric CO2 = 2.13 Gt of carbon (1 Gt = 109 metric ton). For a current estimate of atmospheric CO2 we'll use 380 ppmv (380 x 2.13 x 109 = 809,400,000,000mt). The pre-Industrial Revolution estimate is ~278 ppmv (278 x 2.13 x 109 = 592,140,000,000mt). The difference between those figures is 217,260,000,000mt for net increment (regardless of cause). The estimated temperature increment is +0.875 °C (yes, we know that's 175% of the estimated global increment -- pretend, OK?). Assuming a linear response, the per metric ton response = 0.875/217,260,000,000 = ~0.000000000004027 or ~4.027e-12 (for the pedantic that's for the land only increment -- it's ~0.000000000002301 or 2.301e-12 for the global increment of 0.5/217,260,000,000). Atmospheric persistence is derived from CDIAC's calculated 173.6/441.5 or roughly 39.32% persistence in the atmosphere (that means the atmospheric carbon increment, 288 ppmv in 1850 to 369.5 ppmv in 2000, for an increase of 81.5 ppmv x 2.13 Gt = 173.595, divided by the calculated carbon emission over the period 1850-2000 -- the calculated emission is made up of land-use changes: 154 Gt; fossil fuel use: 282 Gt; cement manufacture: 5.5 Gt, so 154 + 282 + 5.5 = 441.5). If you gave your offset as carbon dioxide we converted to carbon (input x 12/44 since the atomic weight of carbon is 12 and oxygen is 16, thus carbon (12) + O2 = 12 + 32 means CO2 = 12 + 16 + 16 = 44). Now you can see how we came up with your inflated estimate, we simply converted your offset to metric tons if required, multiplied by atmospheric persistence and then the derived per metric ton response rate and there's your 'saving', converted to °F if you so requested. The cost per degree is merely the dollar value that you input divided by the offset you provided (converted to metric ton) and then multiplied by the number of tons required to 'save' one degree in your nominated scale -- simple, isn't it? If you didn't provide a cost then we calculated a degree 'saving' in your desired scale at a default price of $50 per metric ton (mt) of carbon dioxide (this is about the €40 per metric ton stage one EU ETS penalty rate 2005-2007 and hence a proxy for the maximum forced purchase cost in the only region silly enough to actually engage in hot air trading -- if they persist beyond 2007 the penalty rate is booked to become €100 per metric ton for the second period 2008-2012 but we do not anticipate upping the default rate to $125/mt). Of course, assuming the planet's entire net temperature variance since industrialization is a response to atmospheric carbon (unlikely, but pretend), the estimated global response of 0.5 °C means you'd need to prevent 434.52 Gt carbon accumulation to 'prevent' 1 °C warming - taking atmospheric persistence into account that means not emitting 1,102.532 Gt carbon (the equivalent of 4,042.617 Gt CO2) which, at current emission rates, means zero anthropogenic carbon emissions for about 120 years (good luck with that). For those interested in directly comparing the land only rate (post-IR response = 0.875 °C), the numbers are 248.3 Gt, 630.03 Gt, 2,310.09 Gt CO2 and about 70 years respectively. These numbers are for total cessation of all anthropogenic carbon emissions and assume a linear response, an assumption which vastly overstates potential response. Update: From the surge in early e-mails it's apparent there are plenty of curious souls who are burning to know how the logarithmic figures rough out and we can give you approximations from the same range we used in our Greenhouse Primer (drawn from discussion of sensitivity calculations in a hypothetical cloud-free atmosphere and consequently overstating carbon dioxide's role, consult that document for details). Using Charnock & Shine's impossibly large sensitivity, 1 °C warming could be 'saved' by preventing about 490 Gt carbon accumulation, 1,246 Gt carbon emission or about 4,570 Gt CO2 emission -- at current rates the equivalent of roughly 140 years total human contribution. Kondratjew & Moskalenko's estimate gives us 916 Gt carbon accumulation, 2,329 Gt carbon emission and 8,540 Gt CO2 emission, 260 years worth of emissions at current rate. Approximating from Lindzen's numbers, those we found most reasonable in our previous investigation, we get 1,620 Gt carbon accumulation, 4,116 Gt carbon emission and 15,095 Gt CO2 emission -- meaning that if we go from our current emissions to zero right now, in about 460 years we will have 'saved' 1 °C of hypothetical warming. -- end update. Now do you see why we are less than excited about carbon dioxide? Now can you see why one or five or a dozen Kyotos are expected to have zero measurable impact on planetary temperature? If it requires zero emissions for 70-120 years to 'prevent' 1 °C warming at our pretend linear sensitivity and the best then the world is demonstrably insensitive to anthropogenic carbon emissions, isn't it. And since temperature response to atmospheric carbon is logarithmic rather than linear then the above estimates are wildly optimistic. In fact, there remains no evidence that humans would ever be able to emit sufficient carbon dioxide to cause a +1 °C warming -- any more than failure to emit any amount could 'prevent' such an occurrence. Of all the things people can do to the planet -- and for sure we are capable of making plenty of alterations to suit ourselves -- the temperature response from carbon dioxide emissions is simply too trivial to worry about. Think you are 'saving the planet' paying conscience money for trivial amounts of carbon? Sorry, you are getting ripped off. Carbon constraint is a distraction -- a nonsense. Save your money or direct it to some useful purpose, like maybe addressing malaria and lack of potable water, sanitation and development in the third world -- most anything would be better than giving it to con artists and hot air sellers. Anyone who found themselves a bit lost following through the above would probably profit considerably by reviewing our Greenhouse Primer. In fact, it's recommended reading anyway.
Copyright © 2006 JunkScience.com - All Rights Reserved
|