"Global warming," also known as "enhanced greenhouse" will not cause catastropheJunkScience.com
|
|
|
We will not cover again here whether the warming is genuine or an artifact of changing measurement but simply assume it to be a fact.
One hypothesis seeking to explain this possible increase is the "enhanced greenhouse hypothesis" which, loosely stated, postulates that the small increase in temperature resulting from adding more carbon dioxide to the atmosphere and hence adding to the natural greenhouse effect will trigger "positive feedback" mechanisms (multiplier effects) such as increased evaporation adding to the major greenhouse gas, water vapor, in a self-perpetuating cycle of more warming leading to yet more evaporation and more greenhouse gas.
When trying to understand the effects of changing atmospheric constituents we have only two immediate options:
- we observe what actually occurs and has done in the past or;
- we attempt to represent the world in models with mathematical formulae and see what effect changes in input have on model output.
Both these options have limitations. In the first instance we suffer a lack of good observational data over long time periods, so estimating likely responses is limited. In the second, which is the only means we have of manipulating such an enormous system as global climate to observe the response, we are severely hampered by poor understanding of all the various facets and drivers of global climate and hence by far-from-perfect model representations.
We can not magically produce high quality, long-term climate records, so option one will not prove very helpful as far as records of what the world has done in the past is concerned, although we can perhaps use contemporary records (we'll come back to this shortly). Regarding models there have been vast word counts expended extolling the virtues and shortcomings of each so we will deal with them only in passing.
Irrespective of the model flavor used, from the most basic to the multipartite coupled models utilizing each other's output as dynamic input, all models are by necessity overly simplistic and inadequate to represent the chaotic, nonlinear coupled system we call climate. While the average of model representations of global climate suggests Earth's mean temperature is about 14 °C (287 K), the 16 most trusted and 'stable' models tested in the Coupled Model Intercomparison Project (CMIP) (see original .pdf) are not well able to reproduce this result.
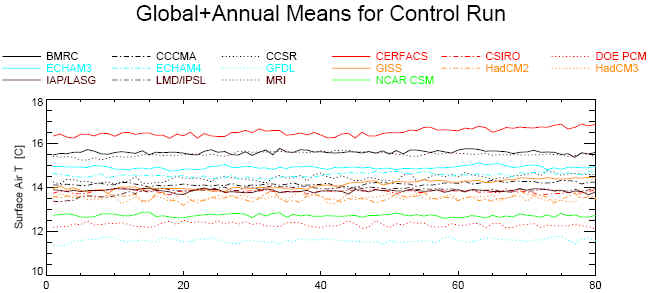 This graphic represents the unforced control runs for the "ensemble" (IPCC-speak for "haven't got a clue if any of these actually represent reality -- throw 'em all together and say the errors average out"). The range starts out guessing mean Earth surface temperature as anything from 11.5 to 16.5 °C (roughly 285-290 K) and ends -- without messing with carbon dioxide levels or anything else -- with the guesses even further apart. If they can't agree where they should start in a 5 °C range how are they supposed to figure out trends an order of magnitude smaller?
Note also that several of these models produce at least as much warming as we think we have measured over the entire Twentieth Century absent any additional forcing whatsoever. Seven of the sixteen controls even suggest the world should be a little (or a lot) warmer than we believe it to be at present (how's that for "consensus"?).
Precipitation results for the various models are similarly erratic, signifying a huge problem in the way models handle the most important greenhouse gas: water vapor. At this time they appear more a disarray of models and we will not be paying attention to model "guesstimations" any time soon.
How can we sort out whether a potential problem exists when neither model nor historical records are up to the task?
Let's try to do it with records from the period for which we do have good data and note how the world actually responds to warming events to see if we can find any indication of the "positive feedback mechanisms" we spoke of before.
We know there's an annual warming, quite a severe one, in fact:
This is as reported by the National Climatic Data Center, the means 1961-1990 (commonly used as a reference period) work out the same globally but do differ slightly on a regional basis:
|
Combined Mean Surface Temp. |
JAN |
FEB |
MAR |
APR |
MAY |
JUN |
JUL |
AUG |
SEP |
OCT |
NOV |
DEC |
Annual |
|
1880 to 2004 (°C) |
12.0 |
12.1 |
12.7 |
13.7 |
14.8 |
15.5 |
15.8 |
15.6 |
15.0 |
14.0 |
12.9 |
12.2 |
13.9 |
|
1880 to 2004 (°F) |
53.6 |
53.9 |
54.9 |
56.7 |
58.6 |
59.9 |
60.4 |
60.1 |
59.0 |
57.1 |
55.2 |
54.0 |
57.0 |
 There is always the possibility this temperature effect is a seasonal artifact of near-surface measurement so we should check atmospheric measures. UAH MSU data tells us the lower troposphere global mean varies somewhat less than near-surface temperature with monthly averages rising and falling approximately 2.3 °C through the year (there's no significant difference between UAH and RSS lower tropospheric data). The Northern Hemisphere (where most people live) cycles an impressive 9.76 °C through the monthly averages as far as lower tropospheric measures are concerned and a whopping 11.6 °C according to land-based near-surface measures.
With global and hemispheric variation to this extent each and every year it is somewhat difficult to view an estimated change of
Given the enormous effort devoted to and concern over the enhanced greenhouse hypothesis we must assume therefore that Earth is on the threshold of some critical bound, encroachment beyond which will cause some new state to be triggered or new physics to apply. How could we see if some relatively trivial increase independent from and embedded within the large temperature range traversed by the planet each year could or would prove critical? As it happens a relatively recent event provides a means of testing that scenario too.
 Depicted in the adjacent graphic is Earth's response to the 1997/98 El Niño event. These are anomalies and several of the datasets produce anomalies with reference to different base periods but that is of no particular interest here -- only the synchronous warming and subsequent cooling depicted in the atmospheric series (UAH and RSS satellite, HadAT radiosonde balloon) and near-surface land and sea surface datasets (NCDC, GISS and HadCRUT3) of ~0.9 and ~0.5 K respectively.
This warming and subsequent cooling is in addition to the normal seasonal global variation (plotted as variation from the expected monthly mean temperature in each case) and thus provides precisely the situation in which we are interested. Since the world cooled almost as abruptly as it warmed we can only assume no positive feedback mechanism was invoked and thus Earth is not perilously perched upon some critical temperature threshold beyond which new physics takes over and runaway enhanced greenhouse warming becomes a self-perpetuating nightmare.
Science works by falsification and, in and of itself, our single depicted event is not sufficient to invalidate the enhanced greenhouse hypothesis, despite doing it no favors. What may prove fatal, however, is the recent demonstration of an alternate mechanism which is completely sufficient to explain Earth's estimated warming since the Industrial Revolution without invoking magical thresholds hidden within large annual variation. You can see the file on "Cosmic Rays and Earth's Climate" here.
Suggested additional reading:
- Cosmic Rays and Earth's Climate
- The Real 'Inconvenient Truth'
- The Real 'Carbon Footprint' Calculator
- Supporting data for the Real 'Carbon Footprint' Calculator
- If 'Global Warming' is real, what could be causing it?
- The pub trivia guide to global warming
- 'Global Warming' at a glance
- 'Global Warming' Proxies
HOME
Copyright © 2006 JunkScience.com - All Rights Reserved