The question has been asked (rightly): Is there nowhere absolute global mean temperatures are recorded? The answer is yes, NASA's National Climatic Data Center publishes monthly figures which, in planetary terms at least, are near real-time. We'll be using their monthly figures as a comparison with our 'Tuppeny Global Thermometer'.
|
NCDC's Monthly Averages 1961-1990 (°C)
|
|
Jan
|
Feb
|
Mar
|
Apr
|
May
|
Jun
|
Jul
|
Aug
|
Sep
|
Oct
|
Nov
|
Dec
|
|
12.07
|
12.21
|
12.83
|
13.83
|
14.86
|
15.56
|
15.83
|
15.68
|
15.05
|
14.05
|
13.01
|
12.32
|
The above table is, rather obviously, the monthly mean figures derived from NCDC's published temperature table (their rationale for using means 1961-1990 is that this is apparently the best sampled period). Their mean of means for the period works out at 13.94 °C, close enough to the GISS-derived 14
°C (± 0.7 °C) nominal global annual mean that we won't worry about it. As can be seen in the above table there is a range of 3.75 °C in the monthly means and obviously greater range will be evident over all the monthly temperatures recorded. NCDC calculate these figures by combining Sea Surface Temperatures (SST 70%) with surface Land Air Temperatures (LAT 30%). See Global Surface Temperature Anomalies for the "nuts and bolts" on how they do this.
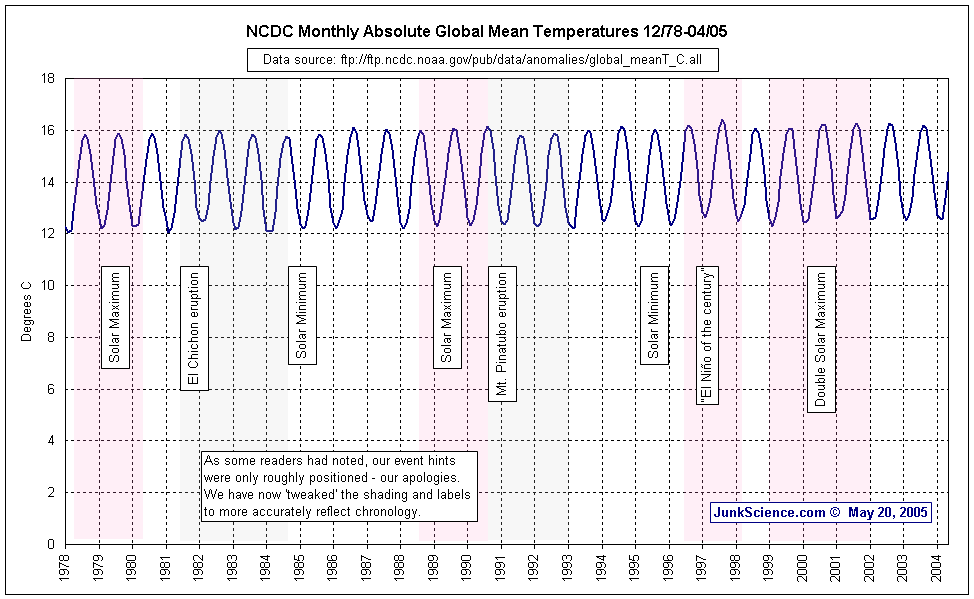
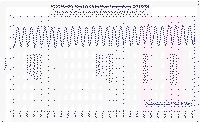 As is our wont we have graphed the series from 12/78 onwards (for compatibility with the world's only truly near-global data set - the satellite-mounted MSU-derived anomaly set provided by UAH). Fascinatingly, there is a piddling warming trend over the quarter century displayed (y = 0.0014x + 13.93) - hardly unexpected given the lack of explosive volcanic events and solar activity allegedly its most frenetic in a millennium. Really makes you wonder how this has morphed into the biggest, baddest warming in oh, forever - and it's all humanity's fault too!
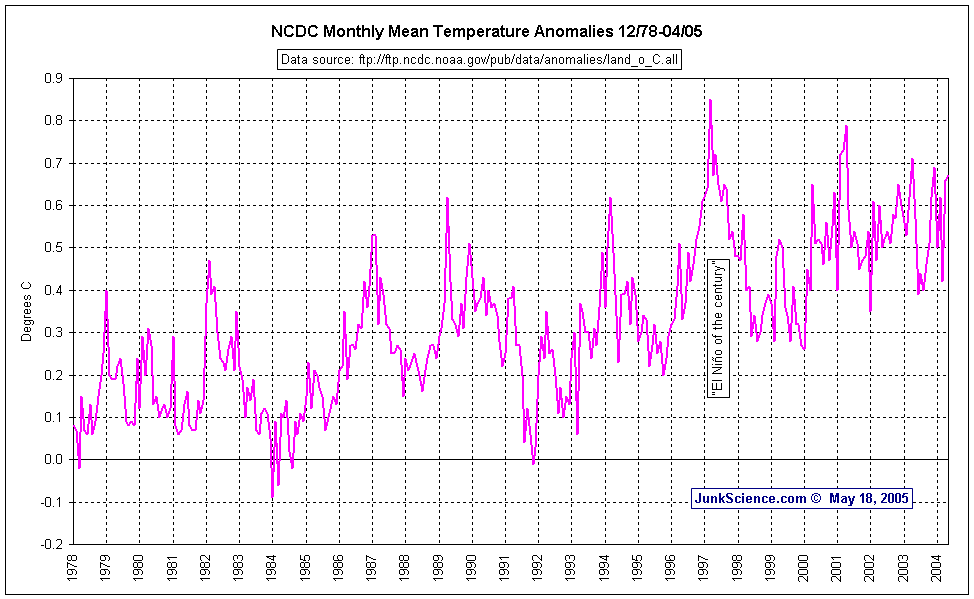
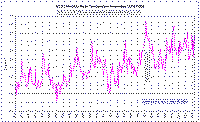 Compare that presentation with this one:
Hmm... looks very different doesn't it? And the magic numbers are [the envelope please]... y = 0.0014x + 0.0913.
Gosh! What a difference rescaling makes. We have already seen that in absolute temperature terms there has been well, insignificant global change and yet here we see a story of apparent rapid warming derived from exactly the same data over the same period. What's going on?
In truth, not much beyond a statistical sleight-of-hand. Granted, there has been a slight warming - nothing to write home about but a warming nonetheless. Simultaneously, there has been a global 'less-colding,' if we may coin a term. The net effect is to drag up the mean temperature and hence the anomaly but the actual effect on planetary temperatures is obviously not particularly significant.

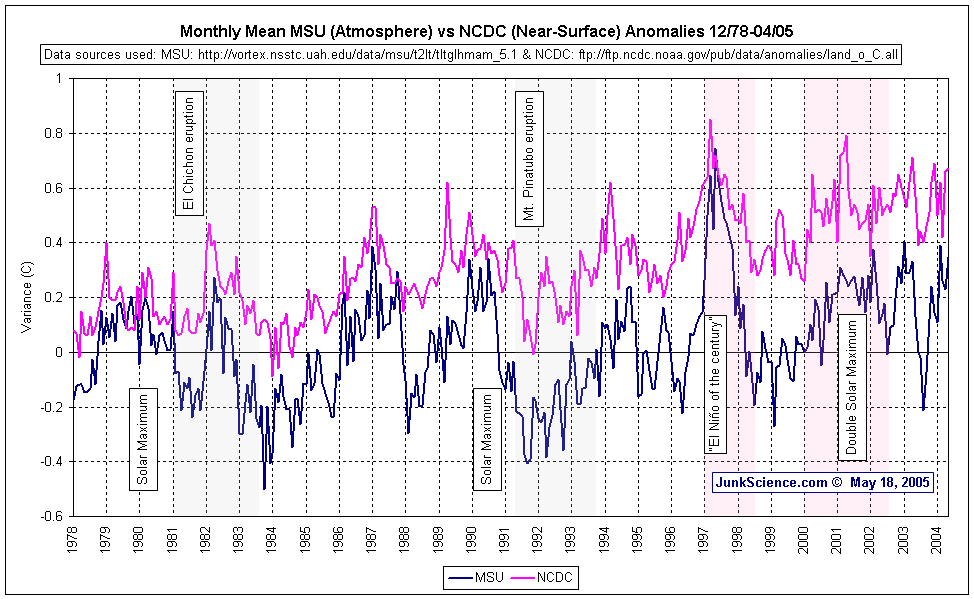
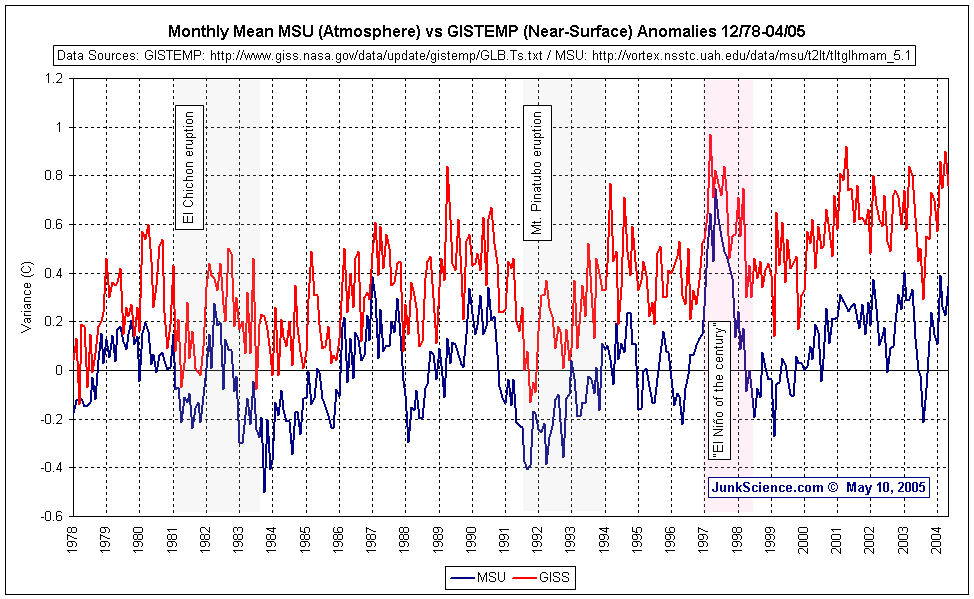
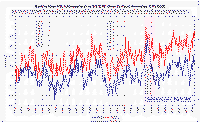 NCDC's anomaly track appears to suffer from similar though slightly smaller divergence from the satellite-mounted MSU data as does GISTEMP. We find this somewhat surprising given their heavy reliance on SSTs and raises the question of just how good SSTs are as a proxy for near-surface air temperatures. Does it indicate a problem? We don't know but it is certainly something to ponder.
Oh well, referring back to our global mean temperature track we can see that global temperatures as measured/derived by NCDC vary in phase with the Northern Hemisphere seasons, as we predicted our derived measures would do and indeed appear to be doing so far. Given NCDC's weighted Sea Surface Temperature (SST) inclusion in their calculations we expect our METAR-derived numbers to exhibit a significantly greater range than NCDC's (since landmasses warm and cool very rapidly compared with oceans).
Each month we will post our derived temperatures alongside NCDC's. It will be interesting to see how our results compare with the multi-billion-dollar global warming industry's, won't it? However the numbers work out our 'Tuppeny Global Thermometer' has already surprised a number of people with the realisation that Earth's temperatures are far from static. Doubtless many more will wonder at the cost of Kyoto when the maximum achievable 'saving' by 2050 is less than one-fiftieth part of Earth's mean temperature change over the course of an average year.
Makes this look a really foolish expense doesn't it.
JunkScience.com