8.6 20th Century Climate and Climate Variability
8.6.1 20th Century Coupled Model Integrations Including
Greenhouse Gases and Sulphate Aerosols

Figure 8.15: Observed (Parker/Jones) and modelled global annual mean
temperature anomalies (°C) from the 1901 to 1930 climatological average.
The control and three independent simulations with the same greenhouse gas
plus aerosol forcing and slightly different initial conditions are shown
from CGCM1 (Boer et al., 2000). The greenhouse gas alone simulation is labelled
GHG. The three greenhouse gas plus aerosol simulations are labelled GHG+Asol1,
GHG+Asol2 and GHG+Asol3, respectively. |


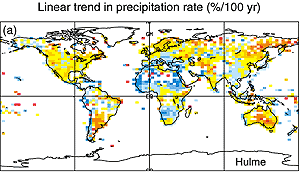
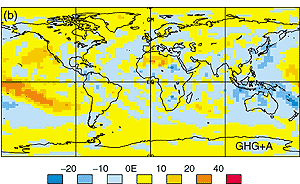
Figure 8.16: The geographical distribution of the linear trend in
annual-mean precipitation (%/100 yr) for (a) the observations of Hulme (1992,
1994); (b) the ensemble of three greenhouse gas + aerosol integrations using
the CCCma model. Taken from Boer et al. (2000). |
Since the pioneer experiments conducted at the Hadley
Centre for Climate Prediction and Research (Mitchell et al. 1995) and at the
Deutsche Klimarechenzentrum (DKRZ) (Hasselmann et al. 1995), reported in the
SAR, a number of other groups internationally have reproduced the trend in the
surface air temperature instrumental record over the 20th century. These include
the Canadian Center for Climate Modelling and Analysis (CCCma) (Boer et al.
2000), Centre for Climate System Research/National Institute for Environmental
Studies (CCSR/NIES) (Emori et al. 1999), Commonwealth Scientific and Industrial
Research Organization (CSIRO), Geophysical Fluid Dynamics Laboratory (GFDL)
(Haywood et al. 1997) and the National Center for Atmospheric Research (NCAR)
(Meehl et al. 2000b). Many of these new contributions, including recent experiments
at the Hadley Centre and DKRZ, include an ensemble of projections over the 20th
century (e.g., Figure 8.15). Such an ensemble allows for
an estimate of intra-model variability, which in the case of the CCCma model
(Figure 8.15), is larger than the possible anthropogenic
signal through the early part of the 20th century (cf., inter-model variability
shown in Figure 9.3).
Coupled models that have been used to simulate changes over the 20th century
have all started with “control model” levels of atmospheric CO2 (typically
330 ppm). This initial condition is then referred to as the “pre-industrial”
initial condition. Changes in radiative forcing are then calculated by taking
the observed atmospheric equivalent CO2 level over the 20th century as a difference
relative to the actual pre-industrial level (280 ppm), and adding this as a
perturbation to the control model levels. Implicit in this approach is the assumption
that the climate system responds linearly to small perturbations away from the
present climate. Haywood et al. (1997) demonstrated the near linear response
of the GFDL-coupled model to changes in radiative forcing associated with increases
in atmospheric greenhouse gases and sulphate aerosols. When added together,
experiments which included aerosol and greenhouse gas increases separately over
the 20th century yielded a similar transient response (in terms of globally
averaged and geographical distribution of surface air temperature and precipitation)
to an experiment which included both aerosol and greenhouse gas increases. This
analysis is particularly important as it validates the methodological approach
used in coupled model simulations of the 20th century climate.
As noted in the SAR, the inclusion of the direct effect of sulphate aerosols
is important since the radiative forcing associated with 20th century greenhouse
gas increase alone tends to overestimate the 20th century warming in most models.
Groups that have included a representation of the direct effects of sulphate
aerosols have found that their model generally reproduces the observed trend
in the instrumental surface air temperature warming, thereby suggesting that
their combination of model climate sensitivity and oceanic heat uptake is not
unrealistic (see Chapter 9, Section
9.2.1 and Figure 9.7). These same models have
more difficulty representing variability observed within the 20th century instrumental
record (Sections 8.6.2, 8.6.3).
As mentioned in Section 8.6.3, some modelling studies
suggest that the inclusion of additional forcings from solar variability and
volcanic aerosols may improve aspects of this simulated variability. Delworth
and Knutson (2000), on the other hand, note that one of their six 20th century
integrations (using GFDL_R30_c) bears a striking resemblance to the observed
20th century warming which occurs primarily in two distinct periods (from 1925
to 1944 and from 1978 to the present), without the need for additional external
forcing. In addition, all coupled models have shown a trend towards increasing
global precipitation, with an intensification of the signal at the high northern
latitudes, consistent with the observational record (Figure
8.16). Nevertheless, AOGCM simulations have yet to be systematically analysed
for the occurrence of other key observed trends, such as the reduction in diurnal
temperature range over the 20th century and the associated increase in cloud
coverage.
The aforementioned studies all prescribed the temporal and geographical distribution
of sulphate aerosols and included their radiative effects by perturbing the
surface albedo according to the amount of sulphate loading in the atmospheric
column above the surface (see Chapter 6, Sections
6.7, 6.8 and 6.14). This approach
both ignores the indirect effect of these aerosols (i.e., their effects on cloud
formation) as well as weather affects on aerosol redistribution and removal.
Roeckner et al. (1999) made a major step forward by incorporating a sulphur
cycle model into the ECHAM4(ECMWF/MPI AGCM)/OPYC3(Ocean isoPYCnal GCM) AOGCM
to eliminate these shortcomings. In addition, they included the radiative forcing
due to anthropogenic changes in tropospheric ozone by prescribing ozone levels
obtained from an offline tropospheric chemistry model coupled to ECHAM4. The
simulation of the 20th century climate obtained from this model (Bengtsson et
al. 1999), which includes the indirect effect of aerosols, shows a good agreement
with the general 20th century trend in warming (see Chapter
12, Section 12.4.3.3). The results of this study also
suggest that the agreement between model and observed 20th century warming trends,
achieved without the inclusion of the indirect aerosol effect, was probably
accomplished with an overestimated direct effect or an overestimated transient
oceanic heat uptake. Alternatively, since these studies include only idealised
scenarios of sulphate radiative forcing alone (direct and/or indirect) that
do not include the apparent effects of other aerosol types (Chapter
6), one might view the sulphate treatment as a surrogate, albeit with large
uncertainty, for the radiative forcing associated with all anthropogenic aerosols.
As noted in Chapter 2, Sections
2.2.2 and 2.2.3, land surface temperatures show a
greater rate of warming than do lower tropospheric air temperatures over the
last 20 years (see also discussion in Chapter 2, Section
2.2.4). While noting uncertainties in the observational records (Chapter
2, Sections 2.2.2 and 2.2.3),
the National Research Council (NRC) (2000) pointed out that models, which tend
not to show such a differential trend, need to better capture the vertical and
temporal profiles of the radiative forcing especially associated with water
vapour and tropospheric and stratospheric ozone and aerosols, and the effects
of the latter on clouds. Santer et al. (2000) provide further evidence to support
this notion from integrations conducted with the ECHAM4/OPYC3 AOGCM (Bengtsson
et al. 1999; Roeckner et al., 1999) that includes a representation of the direct
and indirect effects of sulphate aerosols, as well as changes in tropospheric
ozone. They showed that the further inclusion of stratospheric ozone depletion
and stratospheric aerosols associated with the Pinatubo eruption lead to a better
agreement with observed tropospheric temperature changes since 1979, although
discrepancies still remain (see Chapter 12, Section
12.3.2 and Figure 12.4).


