11.5.2 Regional Sea Level Change
The geographical distribution of sea level change caused by ocean processes
can be calculated from AOGCM results (see Gregory et al., 2001, for methods).
This was not possible with the simple climate models used by Warrick et al.
(1996). Results for sea level change from ocean processes in the 21st century
are shown in Figure 11.13 for AOGCM experiments
used in Section 11.5.1.1. Some regions show a sea
level rise substantially more than the global average (in many cases of more
than twice the average), and others a sea level fall (Table
11.15) (note that these figures do not include sea level rise due to land
ice changes). The standard deviation of sea level change is 15 to 35% of the
global average sea level rise from thermal expansion.

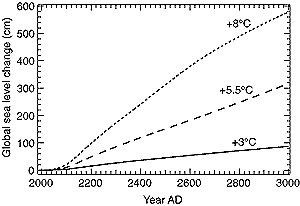
Figure 11.16: Response of the Greenland Ice Sheet to three climatic
warming scenarios during the third millennium expressed in equivalent changes
of global sea level. The curve labels refer to the mean annual temperature
rise over Greenland by 3000 AD as predicted by a two-dimensional climate
and ocean model forced by greenhouse gas concentration rises until 2130
AD and kept constant after that. (From Huybrechts and De Wolde, 1999.) Note
that projected temperatures over Greenland are generally greater than globally
averaged temperatures (by a factor of 1.2 to 3.1 for the range of AOGCMs
used in this chapter). See Table 11.13 and
Chapter 9, Fig 9.10c |
In each of these experiments, a non-uniform pattern of sea level rise emerges
above the background of temporal variability in the latter part of the 21st
century. However, the patterns given by the different models (Figure
11.13) are not similar in detail. The largest correlations are between models
which are similar in formulation: 0.65 between CGCM1 and CGCM2, 0.63 between
GFDL_R15_b and GFDL_R30_c. The largest correlations between models from different
centres are 0.60 between CSIRO Mk2 and HadCM2, 0.58 between CGCM2 and GFDL_R30_c.
The majority of correlations are less than 0.4, indicating no significant similarity
(Gregory et al., 2001). The disagreement between models is partly a reflection
of the differences in ocean model formulation that are also responsible for
the spread in the global average heat uptake and thermal expansion (Sections
11.2.1.2, 11.5.1.1). In addition, the models
predict different changes in surface windstress, with consequences for changes
in ocean circulation and subduction. More detailed analysis is needed to elucidate
the reasons for the differences in patterns. The lack of similarity means that
our confidence in predictions of local sea level changes is low. However, we
can identify a few common features on the regional and basin scale (see also
Gregory et al., 2001).
Seven of the nine models in Table 11.14 (also
Bryan, 1996; Russell et al., 2000) exhibit a maximum sea level rise in the Arctic
Ocean. A possible reason for this is a freshening of the Arctic due to increased
river runoff or precipitation over the ocean (Bryan, 1996; Miller and Russell,
2000). The fall in salinity leads to a reduction of density, which requires
a compensating sea level rise in order to maintain the pressure gradient at
depth.
Seven of the models (also Gregory, 1993; Bryan, 1996) show a minimum of sea
level rise in the circumpolar Southern Ocean south of 60°S. This occurs
despite the fact that the Southern Ocean is a region of pronounced heat uptake
(e.g., Murphy and Mitchell, 1995; Hirst et al., 1996). The low thermal expansion
coefficient at the cold temperatures of the high southern latitudes, changes
in wind patterns and transport of the heat taken up to lower latitudes are all
possible explanations.
Bryan (1996) draws attention to a dipole pattern in sea level change in the
north-west Atlantic; there is a reduced rise south of the Gulf Stream extension
and enhanced rise to the north, which corresponds to a weakening of the sea
surface gradient across the current. This would be consistent with a weakening
of the upper branch of the North Atlantic circulation, which is a response to
greenhouse warming observed in many AOGCM experiments (e.g., Manabe and Stouffer,
1993, 1994; Hirst, 1998). This can be seen in all the models considered here
except ECHAM4/OPYC3, in which the Atlantic thermohaline circulation does not
weaken (Latif and Roeckner, 2000).
Local land movements, both isostatic and tectonic (Sections
11.2.4.1, 11.2.6), will continue in the 21st century
at rates which are unaffected by climate change, and should be added to the
regional variation described in this section. On account of the increased eustatic
rate of rise in the 21st century (Section 11.5.1)
it can be expected that by 2100 many regions currently experiencing relative
sea level fall owing to isostatic rebound will instead have a rising relative
sea level.
All the global models discussed here have a spatial resolution of 1 to 3°.
To obtain information about mean sea level changes at higher resolution is currently
not practical; a regional model such as that of Kauker (1998) would be needed.
