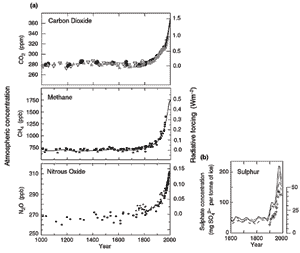
Figure 8: Records of changes in atmospheric composition. (a) Atmospheric concentrations of CO2, CH4 and N2O over the past 1,000 years. Ice core and firn data for several sites in Antarctica and Greenland (shown by different symbols) are supplemented with the data from direct atmospheric samples over the past few decades (shown by the line for CO2 and incorporated in the curve representing the global average of CH4). The estimated radiative forcing from these gases is indicated on the right-hand scale. (b) Sulphate concentration in several Greenland ice cores with the episodic effects of volcanic eruptions removed (lines) and total SO2 emissions from sources in the US and Europe (crosses). [Based on (a) Figure 3.2b (CO2), Figure 4.1a and b (CH4) and Figure 4.2 (N2O) and (b) Figure 5.4a] |
Like the record of past climate changes, the data sets for forcing agents are of varying length and quality. Direct measurements of solar irradiance exist for only about two decades. The sustained direct monitoring of the atmospheric concentrations of carbon dioxide (CO2) began about the middle of the 20th century and, in later years, for other long-lived, well-mixed gases such as methane. Palaeo-atmospheric data from ice cores reveal the concentration changes occurring in earlier millennia for some greenhouse gases. In contrast, the time-series measurements for the forcing agents that have relatively short residence times in the atmosphere (e.g., aerosols) are more recent and are far less complete, because they are harder to measure and are spatially heterogeneous. Current data sets show the human influence on atmospheric concentrations of both the long-lived greenhouse gases and short-lived forcing agents during the last part of the past millennium. Figure 8 illustrates the effects of the large growth over the Industrial Era in the anthropogenic emissions of greenhouse gases and sulphur dioxide, the latter being a precursor of aerosols.
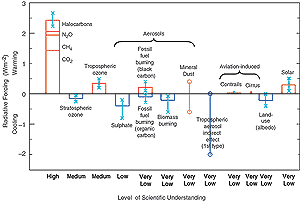
A change in the energy available to the global Earth-atmosphere system due to changes in these forcing agents is termed radiative forcing (Wm-2) of the climate system (see Box 1). Defined in this manner, radiative forcing of climate change constitutes an index of the relative global mean impacts on the surface-troposphere system due to different natural and anthropogenic causes. This Section updates the knowledge of the radiative forcing of climate change that has occurred from pre-industrial times to the present. Figure 9 shows the estimated radiative forcings from the beginning of the Industrial Era (1750) to 1999 for the quantifiable natural and anthropogenic forcing agents. Although not included in the figure due to their episodic nature, volcanic eruptions are the source of another important natural forcing. Summaries of the information about each forcing agent follow in the sub-sections below.
The forcing agents included in Figure 9 vary greatly in their form, magnitude and spatial distribution. Some of the greenhouse gases are emitted directly into the atmosphere; some are chemical products from other emissions. Some greenhouse gases have long atmospheric residence times and, as a result, are well-mixed throughout the atmosphere. Others are short-lived and have heterogeneous regional concentrations. Most of the gases originate from both natural and anthropogenic sources. Lastly, as shown in Figure 9, the radiative forcings of individual agents can be positive (i.e., a tendency to warm the Earth's surface) or negative (i.e., a tendency to cool the Earth's surface).
Figure 9: Global, annual-mean radiative forcings (Wm-2) due to a number of agents for the period from pre-industrial (1750) to present (late 1990s; about 2000) (numerical values are also listed in Table 6.11 of Chapter 6). For detailed explanations, see Chapter 6.13. The height of the rectangular bar denotes a central or best estimate value, while its absence denotes no best estimate is possible. The vertical line about the rectangular bar with "x" delimiters indicates an estimate of the uncertainty range, for the most part guided by the spread in the published values of the forcing. A vertical line without a rectangular bar and with "o" delimiters denotes a forcing for which no central estimate can be given owing to large uncertainties. The uncertainty range specified here has no statistical basis and therefore differs from the use of the term elsewhere in this document. A "level of scientific understanding" index is accorded to each forcing, with high, medium, low and very low levels, respectively. This represents the subjective judgement about the reliability of the forcing estimate, involving factors such as the assumptions necessary to evaluate the forcing, the degree of knowledge of the physical/chemical mechanisms determining the forcing, and the uncertainties surrounding the quantitative estimate of the forcing (see Table 6.12). The well-mixed greenhouse gases are grouped together into a single rectangular bar with the individual mean contributions due to CO2, CH4, N2O and halocarbons shown (see Tables 6.1 and 6.11). Fossil fuel burning is separated into the "black carbon" and "organic carbon" components with its separate best estimate and range. The sign of the effects due to mineral dust is itself an uncertainty. The indirect forcing due to tropospheric aerosols is poorly understood. The same is true for the forcing due to aviation via its effects on contrails and cirrus clouds. Only the "first" type of indirect effect due to aerosols as applicable in the context of liquid clouds is considered here. The "second" type of effect is conceptually important, but there exists very little confidence in the simulated quantitative estimates. The forcing associated with stratospheric aerosols from volcanic eruptions is highly variable over the period and is not considered for this plot (however, see Figure 6.8). All the forcings shown have distinct spatial and seasonal features (Figure 6.7) such that the global, annual means appearing on this plot do not yield a complete picture of the radiative perturbation. They are only intended to give, in a relative sense, a first-order perspective on a global, annual mean scale and cannot be readily employed to obtain the climate response to the total natural and/or anthropogenic forcings. As in the SAR, it is emphasised that the positive and negative global mean forcings cannot be added up and viewed a priori as providing offsets in terms of the complete global climate impact. [Based on Figure 6.6] |
Other reports in this collection |