| |
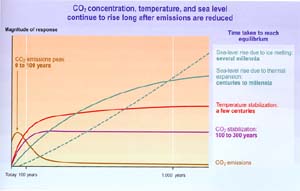
Figure 5-2: After CO2 emissions are
reduced and atmospheric concentrations stabilize, surface air temperature
continues to rise by a few tenths of a degree per century for a century
or more. Thermal expansion of the ocean continues long after CO2
emissions have been reduced, and melting of ice sheets continues to contribute
to sea-level rise for many centuries. This figure is a generic illustration
for stabilization at any level between 450 and 1,000 ppm, and therefore
has no units on the response axis. Responses to stabilization trajectories
in this range show broadly similar time courses, but the impacts become
progressively larger at higher concentrations of CO2 .
|
 WGI TAR Sections 3.7, 9.3,
& 11.5, & WGI
TAR Figures 3.13, 9.16,
9.19, 11.15,
& 11.16
 |
| 5.5 |
The lower the stabilization target for atmospheric
CO2 , the sooner emissions of CO2 would need to
decrease to meet it. If emissions were held at present levels,
carbon cycle models indicate that the atmospheric concentration of CO2
would continue to rise (see Figure 5-3).
- Stabilization of CO2 concentrations at any level requires
ultimate reduction of global net emissions to a small fraction of the
current emission level.
- Stabilization of atmospheric CO2 concentrations at 450,
650, or 1,000 ppm would require global anthropogenic CO2
emissions to drop below the year 1990 level, within a few decades, about
a century, or about 2 centuries, respectively, and continue to decrease
steadily thereafter (see Figure 6-1).
These time constraints are partly due to the rate of CO2 uptake
by the ocean, which is limited by the slow transport of carbon between
the surface and deep waters. There is sufficient uptake capacity in the
ocean to incorporate 70 to 80% of foreseeable anthropogenic CO2
emissions to the atmosphere, but this would take several centuries. Chemical
reaction involving ocean sediments has the potential to remove up to a
further 15% over a period of 5,000 years.
|
 WGI TAR Sections 3.2.3.2,
3.7.3, & 9.3.3.1
 |
| 5.6 |
A delay between biospheric
carbon uptake and carbon release is manifest as a temporary net carbon uptake.
The main flows in the global carbon cycle have widely differing characteristic
time scales (see Figures 5-1
and 5-4). The net terrestrial
carbon uptake that has developed over the past few decades is partly a result
of the time lag between photosyntheticcarbonuptakeand carbonreleasewhenplants
eventuallydieanddecay. For example, the uptake resulting from regrowth of
forests on agricultural lands, abandoned over the last century in the Northern
Hemisphere, will decline as the forests reach their mature biomass, growth
slows, and death increases. Enhancementofplantcarbon uptakeduetoelevated
CO2 or nitrogen deposition will eventually saturate, then decomposition
of the increased biomass will catch up. Climate change is likely to increase
disturbance and decomposition rates in the future. Some models project that
the recent global net terrestrial carbon uptake will peak, then level off
or decrease. The peak could be passed within the 21st century according
to several model projections. Projections of the global net terrestrial
carbon exchange with the atmosphere beyond a few decades remain uncertain
(see Figure 5-5). |
 WGI TAR Sections 3.2.2-3 &
3.7.1-2, & WGI
TAR Figure 3.10
 |
