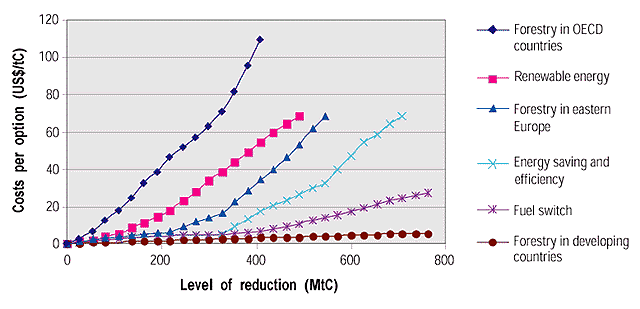
Figure 4.9: Indicative
curves of costs (US$/tC, cost of US$28/tC is equivalent to US$100 per tonne of
CO2) of emission reduction or carbon sequestration by level of total
reduction. The curves display how comparable options vary in costs between world
regions. However, costs per option are also reported to vary widely at comparable
total levels of reduction. This is mainly because cost studies have not been carried
out in the same way. In some options net monetary profit may occur as well (i.e.,
costs may be negative as well) (Brown et al., 1996a, Hol et al., 1999; Jepma et
al., 1997; Sedjo et al., 1995).