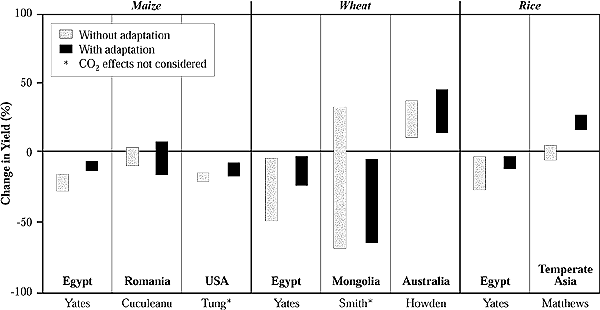
Figure 5-2: Ranges of percentage
changes in crop yields (expressed in vertical extent of the vertical bars only)
spanning selected climate change scenarios—with and without agronomic adaptation—from
paired studies in Table 5-4. Each pair of ranges is differentiated by geographic
location and crop. Pairs of vertical bars represent the range of percentage changes
with and without adaptation. Endpoints of each range represent collective high
and low percentage change values derived from all climate scenarios used in the
study. Horizontal extent of the bars is not meaningful. Note that on the x-axis
the last name of the lead author is listed as it appears on Table 5-4. See Table
5-4 for details on climate scenarios used and types of adaptation strategies modeled
in each study. In the case of Mongolia, adaptation was not modeled when climate
change resulted in positive yield change. In Romania, earlier planting of irrigated
maize results in slightly lower yields than with current planting dates.