| 2.16 |
Changes have also occurred in other
important aspects of climate (see Table 2-1).
|
|
| 2.17 |
Over the 20th century there has been
a consistent, large-scale warming of both the land and ocean surface, with
largest increases in temperature over the mid- and high latitudes of northern
continents. The warming of land surface faster than ocean surface
from the years 1976 to 2000 (see Figure 2-6b) is
consistent both with the observed changes in natural climate variations,
such as the North Atlantic and Arctic Oscillations, and with the modeled
pattern of greenhouse gas warming. As described below, statistically significant
associations between regional warming and observed changes in biological
systems have been documented in freshwater, terrestrial, and marine environments
on all continents.
|
 WGI TAR Sections 2.2.2,
2.6.3, & 2.6.5,
& WGII TAR Section 6.3
 |
| 2.18 |
Warm episodes of the El Niño Southern
Oscillation (ENSO) phenomenon have been more frequent, persistent, and intense
since the mid-1970s, compared with the previous 100 years. ENSO consistently
affects regional variations of precipitation and temperature over much of
the tropics, subtropics, and some mid-latitude areas. It is not obvious
from models, however, that a warmer world would have a greater frequency
of occurrence of El Niño events.
|
 WGI
TAR Section 2.6.2 WGI
TAR Section 2.6.2 |
| 2.19 |
Some important aspects of climate appear
not to have changed. A few areas of the globe have not warmed
in recent decades, mainly over some parts of the Southern Hemisphere oceans
and parts of Antarctica (see Figure 2-6b).
Antarctic sea-ice extent has stayed almost stable or even increased since
1978, the period of reliable satellite measurements. Current analyses are
unable to draw conclusions about the likelihood of changes in the frequency
of tornadoes, thunder days, or hail events for the limited regions that
have been studied. In addition, insufficient data and conflicting analyses
prevent an assessment of changes in intensities of tropical and extra-tropical
cyclones and severe local storm activity in the mid-latitudes.
|
 WGI TAR Sections 2.2.2,
2.2.5, & 2.7.3
 |
|
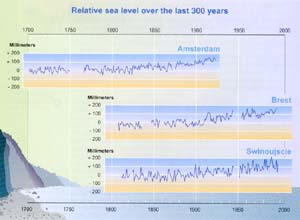
Figure 2-5: A limited number of sites in Europe have nearly continuous
records of sea level spanning 300 years and show the greatest rise in sea
level over the 20th century. Records shown from Amsterdam, The
Netherlands, Brest, France, and Swinoujscie, Poland, as well as other sites,
confirm the accelerated rise in sea level over the 20th century as compared
to the 19th.
|
 WGI TAR Figure 11-7
 |
|
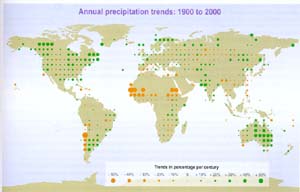
Figure 2-6a: Precipitation during the 20th century has on average
increased over continents outside the tropics but decreased in the desert
regions of Africa and South America. While the record shows an
overall increase consistent with warmer temperatures and more atmospheric
moisture, trends in precipitation vary greatly from region to region and
are only available over the 20th century for some continental regions. Over
this period, there were relatively small long-term trends in land areas
experiencing severe drought or severe wetness, but in many regions these
changes are dominated by inter-decadal and multi-decadal climate variability
that has no trends evident over the 20th century.
|
 WGI TAR Figure 2-25
 |
| |
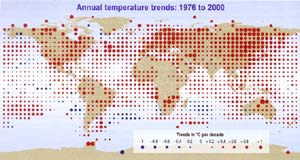
Figure 2-6b: A consistent, large-scale warming of both the land
and ocean surface occurred over the last quarter of the 20th century, with
largest temperature increases over the mid- and high latitudes of North
America, Europe, and Asia. Large regions of cooling occurred only in parts
of the Pacific and Southern Oceans and Antarctica. The warming
of land faster than ocean surface is consistent both with the observed changes
in natural climate variations such as the North Atlantic and Arctic Oscillations
and with the modeled pattern of greenhouse-gas warming. As described in
the text, warming in some regions is linked with observed changes in biological
systems on all continents. |
 WGI TAR Figure 2-9d
 |


