Dearth Day, April 22, 2011
Notice: since UAH lost power for a number of days following the destructive tornado swarm some data is unavailable and there have been subtle changes in the published file structure. This will occasionally confuse the scripts which generate the graphics depicting daily temperatures. We hope to have eliminated these little teething problems within the next few days.
Yes, it's back!
In a radically different format to be sure - see the introduction for the background.
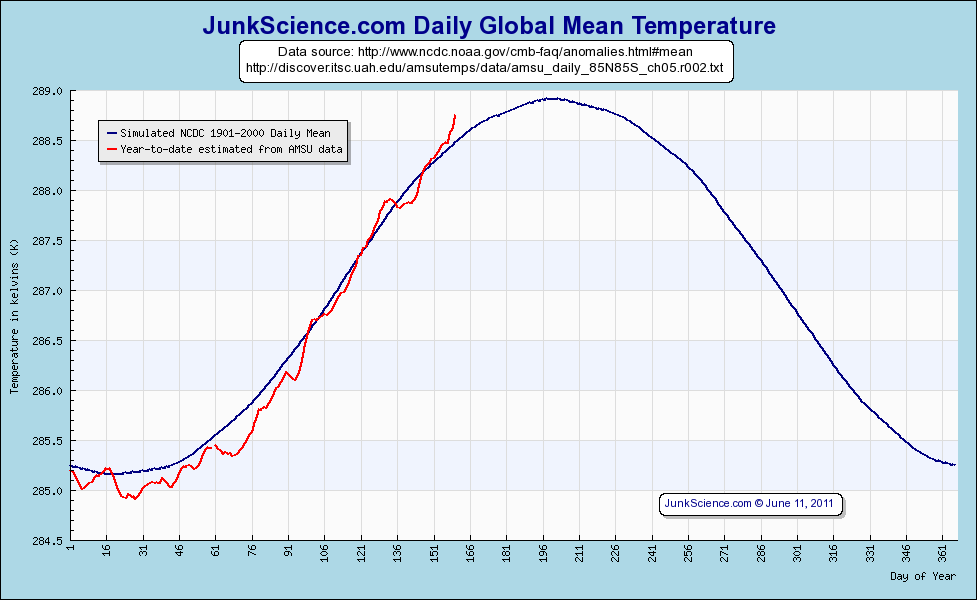
We are quite obviously still developing this page with lots more interesting items to come but, to begin with, here's the story for the year to date:
So, what are we looking at?
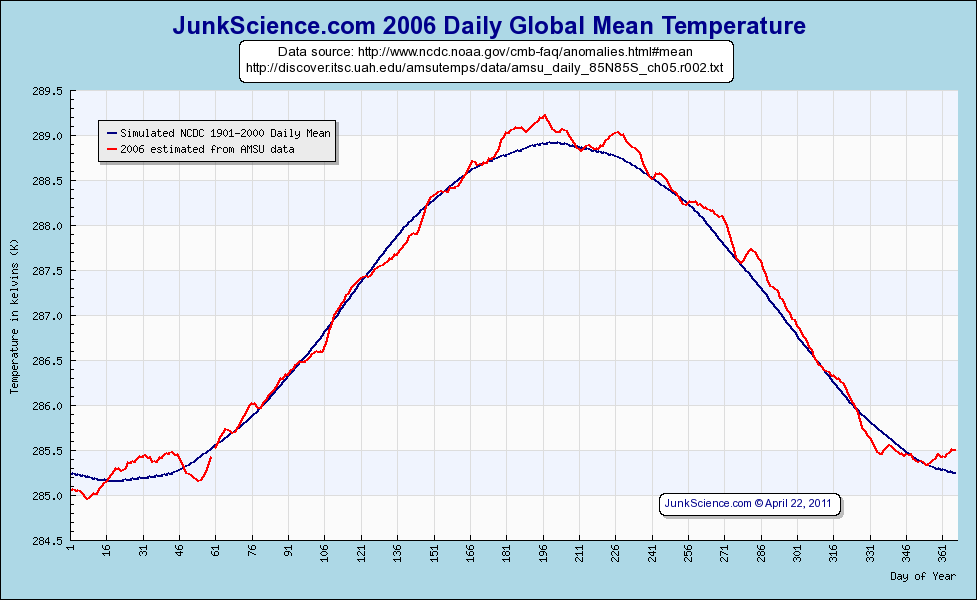
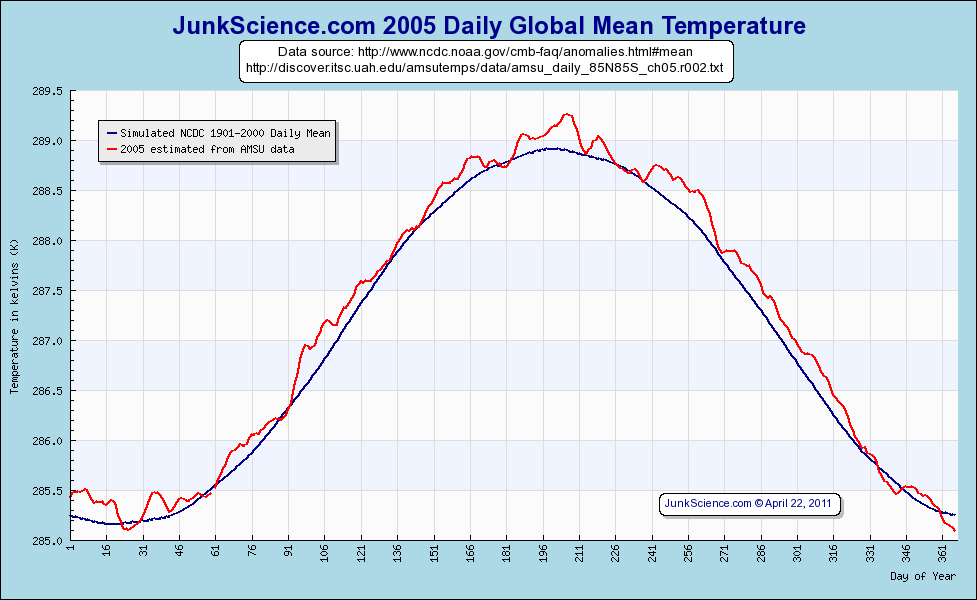
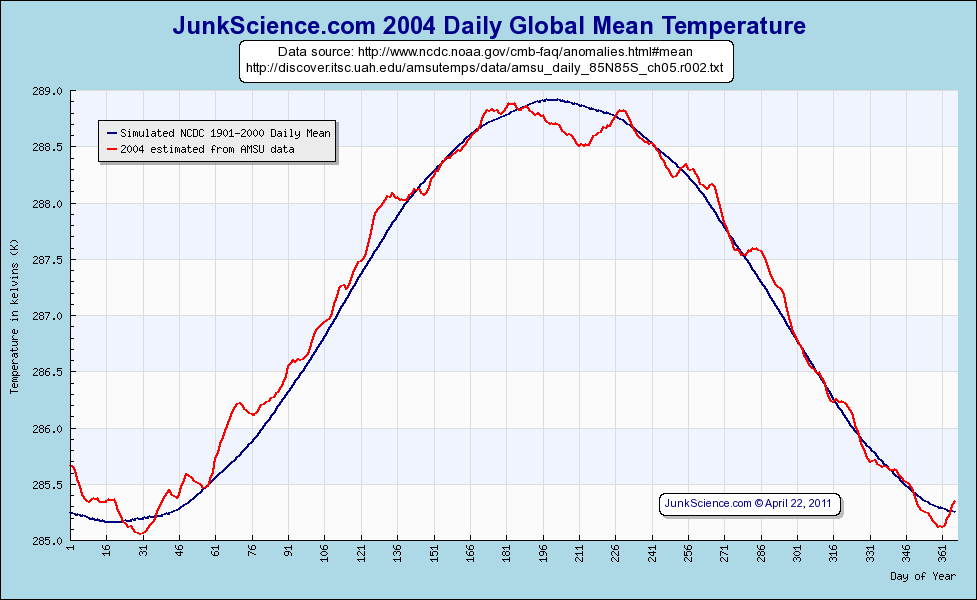
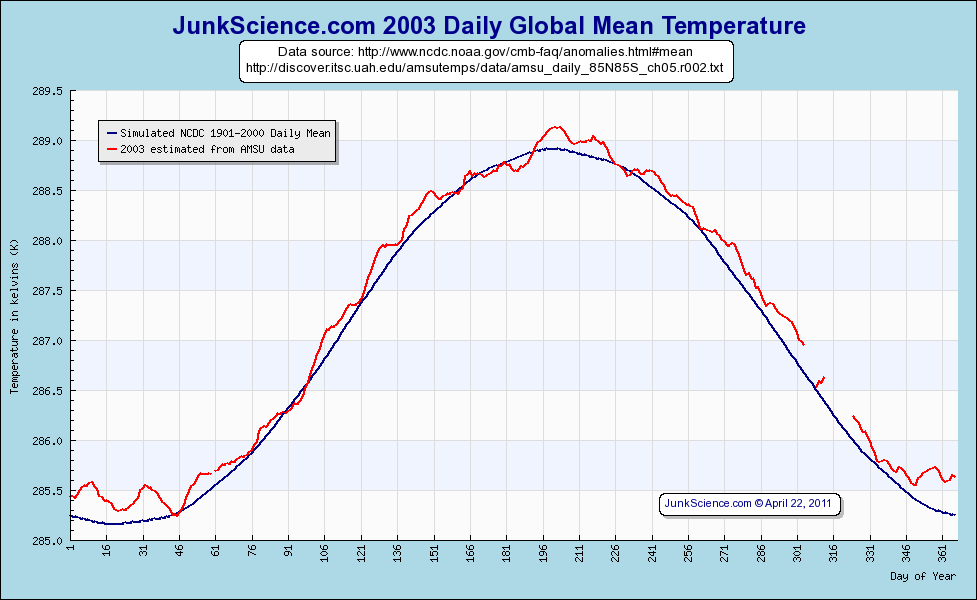
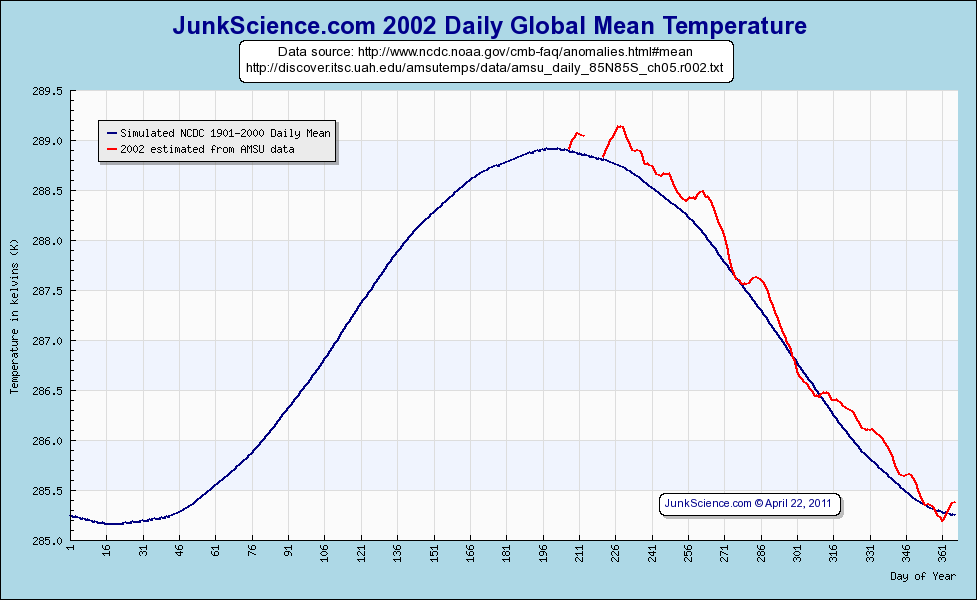
The first graphic presented is this time series - note that it says "Simulated NCDC 1901-2000 Daily Mean" in the legend. Yes, it does give NOAA's NCDC as an initial source but we doubt they'll recognize their data anymore - that's because we used the University of Alabama in Huntsville's AMSU data to infer and generate the plot. Its relation to NCDC's series is that it mostly reproduces their monthly combined near-surface land and sea averages. Although we used UAH's data to synthesize a facsimile of their century-long average time series we think their work should be properly acknowledged, don't you? I would have put "synthesized NCDC..." on the daily temperature graphics too but they are already huge and cumbersome - working on that.
Moreover, we suspect the guys at UAH are unlikely to recognize their preliminary data in this plot either since our temperature guesstimation is for the "people zone" (surface plus) as inferred by atmospheric changes whereas with that particular data stream they are specifically interested in deriving the atmospheric temperature.
Disclaimer: This product is 100%, all-singing, all-dancing JunkScience.com-generated output and responsibility for coding of the graphical output belongs to Barry Hearn, Editor@JunkScience.com - if its broken, blame him and him alone ;-) Neither NOAA's NCDC, University of Alabama in Huntsville nor any of their researchers or their staff have been explicitly or implicitly involved in the production of JunkScience.com's Global Mean Temperature Index and they neither endorse nor support it in any way. That said we must gratefully acknowledge the patient and careful clarifications of their data's focus, limitations and purpose provided by researchers contacted by JunkScience.com during conceptual scoping, construction and delivery of this project. We stand on the shoulders of humble giants.
Bottom line: we are not comparing the apple of UAH AMSU atmospheric temperature with the lemon orange of UHIE-contaminated
near-surface temperatures. Heck, no one knows whether the NCDC absolute near-surface temperature averages are even close to the physical fact but that is
completely irrelevant here. We could arbitrarily make the daily mean "kadiddlehopper" or "flubdub" but we have chosen the more familiar
"temperature", derived from a distinctly non-linear relationship with UAH AMSU data and the NCDC-estimated near-surface monthly temperature means. We
are using the UAH AMSU atmospheric measures to get around the myriad problems so devastatingly identified by Pielke,
Watts and the SurfaceStations.org volunteers. We could use an
arbitrarily zeroed value and produce "anomalies" but then readers wouldn't get to see how the absolute value naturally varies throughout the year,
something we think fairly important given that populations and politicians are being stampeded by hysterical press releases over a few hundredths or even
thousandths of a degree.
Under the bottom line: Please be aware that both time series plotted below are synthesized from UAH AMSU data and that the numbers for the last month or so are preliminary, not having been through final quality checks.
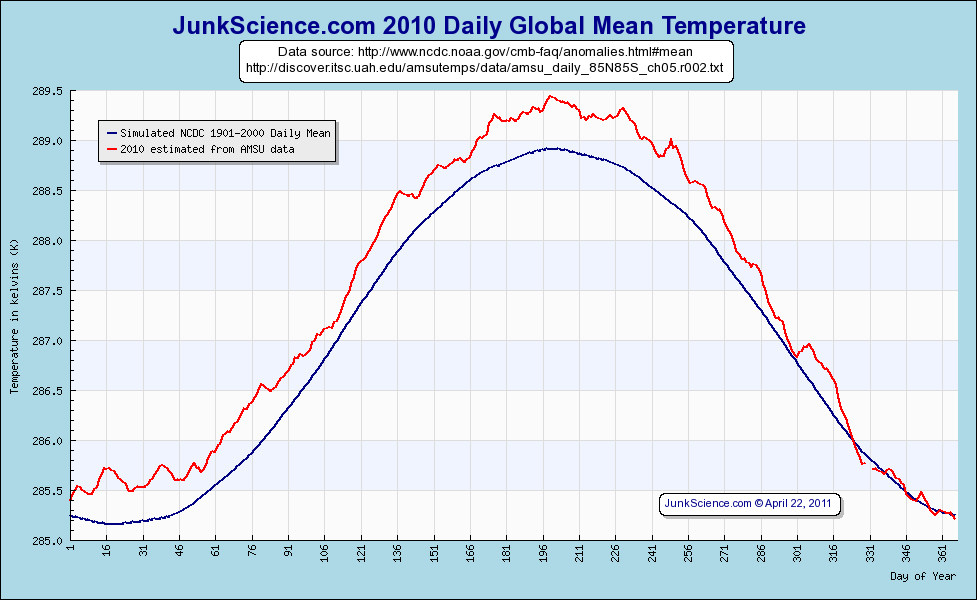
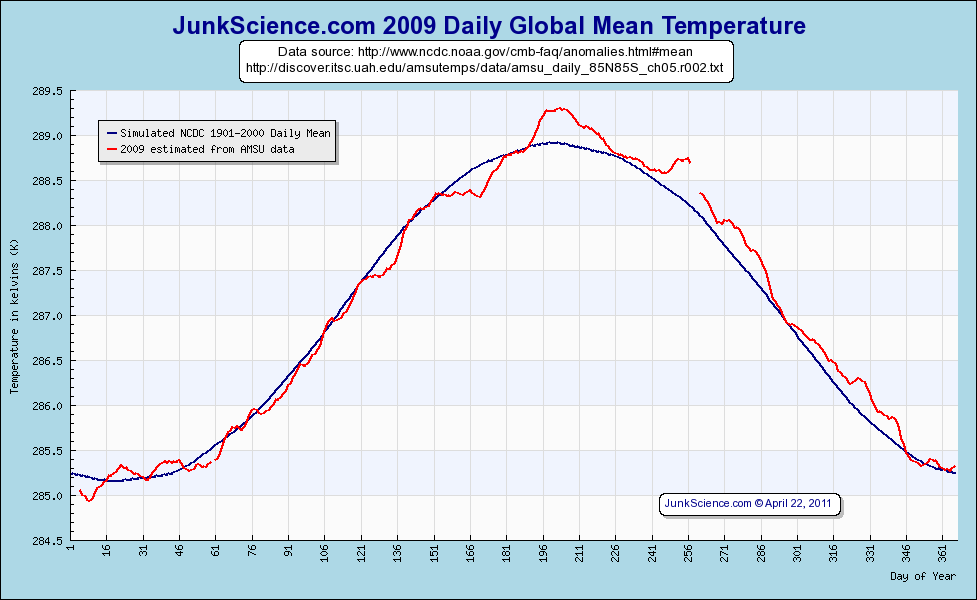
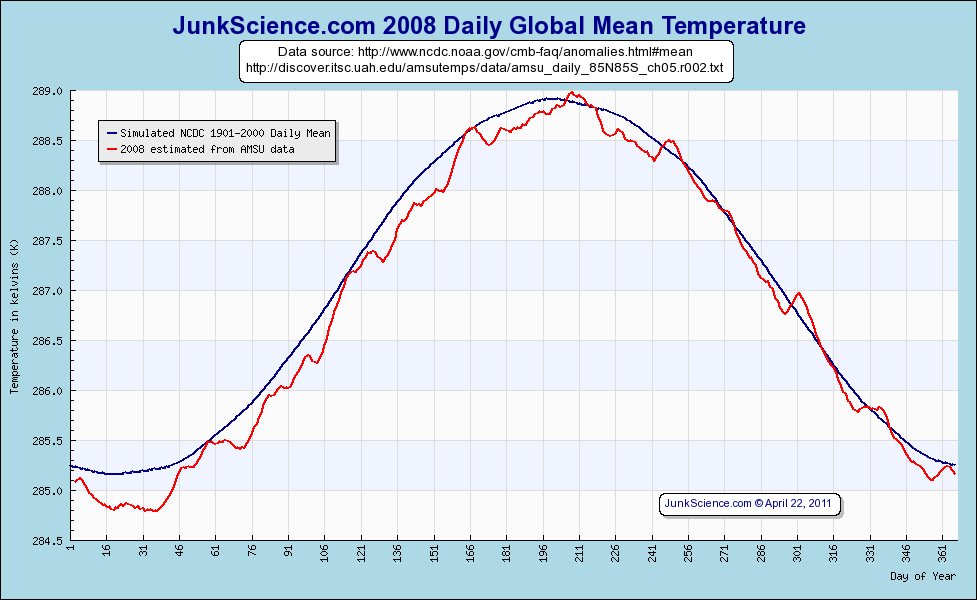
Daily temperature graphics for posting on other sites are below these previous year history time series plots - gaps in the time series reflect the absence of available satellite data, series begins in the second half of 2002. Highlight is the capture of the El Niño temperature signal in 2010 and the sudden collapse to "normal" or below from about October of that year following the onset of La Niña conditions. For the most part we believe the last 9 years have been slightly above the 20th Century mean but not by a lot, or pretty ordinary. Note, too, that this technique accounts for the energy still in the atmosphere rather than simply relying on an amalgam of local surface temperatures:

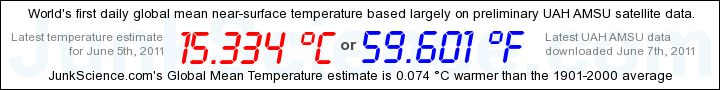
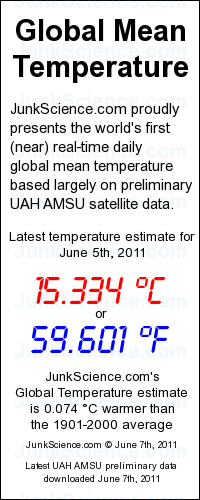
Webmasters wishing to include JunkScience.com's near-real time daily global mean temperatures in their pages may choose from these (more formats to come but for now just these rather large items including indications of just what people are seeing. More graphics coming soon - Update: some smaller graphics now available below:

To use the above, banner-style graphic include the code:
<a href="http://junksciencearchive.com/MSU_Temps/Daily_Mean.html"><img border="0" src="http://junksciencearchive.com/MSU_Temps/Daily_Temp_728x90.png" width="728" height="90"></a>
Note: if your users report missing the above graphic it could be that their ad blocking software interprets it as a google banner ad - try this one instead:
<a href="http://junksciencearchive.com/MSU_Temps/Daily_Mean.html"><img border="0" src="http://junksciencearchive.com/MSU_Temps/Daily_Temp_720x90.png" width="720" height="90"></a>
or, for this tower-style:
<a href="http://junksciencearchive.com/MSU_Temps/Daily_Mean.html"><img border="0" src="http://junksciencearchive.com/MSU_Temps/Daily_Temp_200x500.png" width="200" height="500"></a>
and this somewhat more manageable but less informative 160x200 graphic:
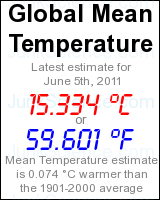
<a href="http://junksciencearchive.com/MSU_Temps/Daily_Mean.html"><img border="0" src="http://junksciencearchive.com/MSU_Temps/Daily_Temp_160x200.png" width="160" height="200"></a>
and for this discrete little fellow:
<a href="http://junksciencearchive.com/MSU_Temps/Daily_Mean.html"><img border="0" src="http://junksciencearchive.com/MSU_Temps/Daily_Temp_120x120.png" width="120" height="120"></a>
Feel free to email a request to editor@junkscience.com if you require a particular dimension graphic for your site. Note that if 200px is too wide to suit your sidebar (or wherever you wish to use the graphic, alter the width parameter from ="200" to ="100%" to shrink it to the available space.